Activation Times in the Ventricular Myocardial Band-Juniper Publishers
JUNIPER PUBLISHERS-OPEN ACCESS JOURNAL OF CARDIOLOGY & CARDIOVASCULAR THERAPY
Opinion
The sequence of left ventricular endo and epicardial
electrical activation was studied in patients by three-dimensional
electroanatomic mapping with a Carto navigation and mapping system
(Biosense Webster, California, USA), which allows a three-dimensional
anatomical representation with activation maps and electrical
propagation. The propagation time of electrical activation was measured
in milliseconds (ms). Isochronic and activation sequence maps were
constructed and correlated with the surface electrocardiogram. Apical,
lateral and basal views were obtained.
As the descending band is endocardial and the
ascending band epicardial, two approaches were used to perform mapping.
The endocardial access was achieved by conventional atrial transeptal
puncture and the epicardial one by a percutaneous approach in the
pericardial space. Endocardial and epicardial mapping was immediately
and consecutively performed.
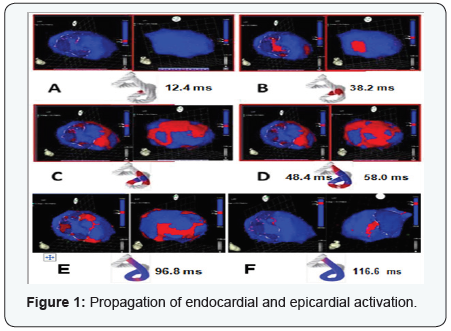
Figure 1 shows the propagation of endocardial and
epicardial activation. In every pair of figures, the left panel shows
the right lateral projection and the right panel the simultaneous left
anterior oblique projection. The activated zones at each moment are
shown in red. The activation of the descending band and ascending band
segments constituting the left ventricular structure in the rope model
[1] is represented below each pair of figures. The depolarized area at
that moment is represented in red and those areas previously activated
and in refractory period are represented in blue. Mean propagation time
of the electrical activation through the ventricular myocardial band is
observed beside each rope.
The activation of the left ventricle initiates in the
interventricular septum, 12.4ms±1.816ms after activation stars (Figure
1A). An epicardial area is also activated at that moment-the ascending
band segment- evidencing radial activation at a point that we called the
“crossing of bandsegments”. This activation starts 25.8ms±1.483ms after
septal stimulation (Figure 1B) and 38.2ms±2.135 after the initiation of
cardiac activation. Simultaneously, it extends axially towards the
ventricular apex, following the anatomical arrangement of the descending
band segment at a mean time of 58ms±2.0ms (Figure 1C & 1D). After
the “crossing of band segments”, the activation loses its unidirectional
character and becomes more complex. Three simultaneous wave fronts are
generated:
- The distal activation of the descending band segment towards the apical loop.
- The depolarization of the ascending band segment from the crossing point towards the apex.
- The activation of this band segment from the crossing point towards the final end of the muscular band in the aorta.

Figure 1D, 1E & 1F show the progression and end of this process. This investigation was the first in humans.
Finally, there is another fact that strongly reinforces this
interpretation; we have indicated that the normal pathway for
left ventricular catheter implantation is through the coronary
sinus, which gives access to the left ventricular epicardial
veins, so that activation propagates from the endocardium
to the epicardium. Although the catheter is properly located
in the mentioned «effective area», there are some «nonresponder
» patients. In recent studies [2] 20% of patients
are non-responders although the catheter implanted through
the coronary sinus is perfectly positioned. When implanted
through an endocavitary pathway, 50% of these patients
become responders. The explanation using the classical
conception is a fairly vague consideration in the sense that
endo-epicardial activation is «more physiological» than the
reverse.
From the perspective of our research, the explanation is
much more coherent. The activation of the ascending band
at the point of band intersection restores its longitudinal
activation, with the beneficial consequences mentioned above.
However, the radial activation from the descending to the
ascending band and the persistent normal distal activation
of the descending segment is lost. Endocavitary stimulation
(descending segment) would almost completely restore the
normal electrical activation and therefore its mechanical
result.

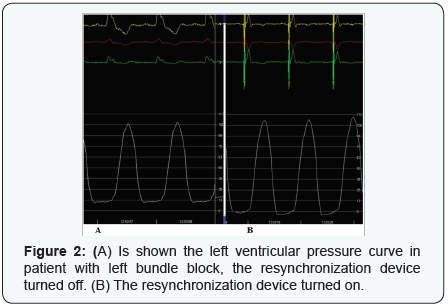
Based on this principle, in Figure 2A is shown the left
ventricular pressure curve in patient with left bundle block.
The resynchronization device turned off. In the same patient
(Figure 2B), the device turned on. Note in the pressure
scale at the right of each panel (in mm Hg) the decrease of
diastolic pressure from 13 to 0mm Hg when the ventricles are
resynchronized. There is also a 10mm Hg increase in systolic
pressure.
According to these concepts [3], we may infer:
- Endo-epicardial three-dimensional mapping shows an electrical activation sequence in the area of the apex loop in agreement with the synchronic contraction of the descending and ascending band segments.
- The simultaneous and opposing activation of the ascending band segment to the starting point of its radial activation from the descending band segment is consistent with the simultaneous reverse rotation of the apical and basal areas (ventricular torsion mechanism).
- Late activation of the ascending band segment, compatible with its persistent contraction during the initial phase of isovolumic diastole.
The novel activation sequence of the Torrent Guasp muscle
band found in the present paper, would explain the process
systolic ventricular torsion and the effect of active suction in
the is volumic diastolic phase.
For more articles in Open Access Journal of
Cardiology & Cardiovascular Therapy please click on: https://juniperpublishers.com/jocct/index.php
To know more about Juniper Publishers please
click on: https://juniperpublishers.business.site/


Comments
Post a Comment