Human Coronary Artery Lesions: 900 MHz Magnetic Resonance Micro Imaging, NMR Spectroscopy, Histopathology and Oxidative Stress Markers-Juniper Publishers
JUNIPER PUBLISHERS-OPEN ACCESS JOURNAL OF CARDIOLOGY & CARDIOVASCULAR THERAPY
Abstract
Aim: 900 MHz Magnetic resonance
imaging (MRI) techniques measured the dimensions of atheroma and
stenosis in excised human coronary plaque disruption and lipid disorder
due to oxidative stress.
Hypothesis: Coronary atheroma is a lipid disorder and MRI visible.
Materials and Methods: Contiguous
cross-sectional T2-weighted fast spin echo MRI images were
point-by-point compared with coronary histopathology for quantitation of
coronary wall and plaque features. Coronary atheroma tissues were used
for NMR spectroscopy and oxidative stress content analysis.
Results: 900 MHz MRI images showed
distinct measurable wall thickness and vessel radii. The quantitative
comparison of lumen areas and wall thickness in endarterectomy specimens
using MRI images and histology images showed mean difference 5.0 % for
lumen area and 4.5 % for wall thickness. MRI data correlated with the
histopathology for aortic wall thickness (R2=0.92, P < 0.0001),
plaque size (R2=0.99, P < 0.0001) and vessel radii (R2=0.79, P <
0.0001). MRI images and histological sections showed intraluminal
thrombus and plaque disruption. High-resolution NMR peaks suggested the
lipid-rich nature of coronary plaque due to presence of triglycerides,
phospholipids, sterols and fatty acids. Oxidative stress markers were
higher in plaque bearing coronary artery homogenates than the normal
coronary artery homogenates. Ex vivo, 900 MHz MRI reliably determined
the presence, location, and size of the thrombus and % stenosis in
coronary artery atherosclerosis and histopathology defined the plaque
composition.
Conclusion: The study demonstrates
the utility of MRI for in vivo measurement of % stenosis and
distinguishes different components of coronary thrombus ex vivo
suggesting the coronary artery plaque as a result of lipid disorder and
oxidative stress.
Introduction
Atherothrombotic is a systemic disease of the
coronary vessel wall that causes coronary artery lesions appearing
heterogeneous in morphology and chemical constitution. Disrupting or
vulnerable plaques in the coronary arteries exhibit a thin fibrous cap
(fibrous cap thickness 65 to 150 μm) with a large lipid core, as defined
by American Heart Association AHA plaque type V-Va [1]. Acute coronary
syndromes often result from disruption of a modestly steno tic
vulnerable plaque. Coronary artery vulnerable plaques occasionally show
high
likelihood of thrombotic complications and rapid progression of lipid
content and a thin fibrous cap [2]. Coronary arteries are thin but their
measurements speculate important clinical correlates [3]. Quantitation
of the high-risk plaque lipid components and degree of stenosis is
state-of-art approach but difficult [4].
However, MRI measures lumen volume, wall thickness,
thrombus size, total plaque volume and characterize the composition of
the plaques. Noninvasive MRI is emerging tool for identification of
flow-limiting coronary Stenoses, calcified plaques, imaging of the
atherothrombotic lesions, measurement of atherosclerotic burden, and ex
vivo characterization of the coronary plaque components. This combined
information for
degree of stenosis and the plaque composition, may predict
cardiovascular risk, atherothrombotic progression and its
response to therapy for the assessment of subclinical disease
[5]. The segmentation of coronary plaque MRI images serves
to generate plaque feature maps as morphological correlates
suggesting heterogeneous nature of coronary plaque [6]. Co
registration of MRI images with histopathology stereotactic
match may provide validity of quantitation. Oxidative stress
causes accumulation of oxidants viz. lipid peroxides and hydro
peroxides during atherothrombotic due to lipid disorder [4,6].
The present report focused on application of MRI in
stenosis and plaque composition. We measured inner / outer
wall perimeters and their radii, plaque features using MRI
and histology co registration to calculate wall thickness,
thrombus area, lumen size and % stenosis in support of MRI
and histological data as possible predictors of stress (higher %
stenosis, elevated oxidative stress markers with NMR visible
lipid peaks) in different branches due to coronary lipid disorder.
We report new approaches of measurement of in vivo plaque
burden at different branches; better stereotactic visualization of
coronary lesion components.
10 male human (mean age 45 +/- 4 years) with 30 % - 80 %
lumen stenosis participated. 14 coronary artery endarterectomy
samples were obtained within 4 hours of cardiac surgery.
Severe atherosclerosis and cardiac death were exclusion criteria
to select the endarterectomy specimens [3,6]. The area of
dissection was defined as a position including right coronary
aorta, left anterior descending and circumflex coronary arteries
about 10 mm away from the anterior descending artery. The
specimens were placed in a device surrounded by phased array
surface coil and fast spin echo (FSE) images were acquired at
GE Horizon 1.5 T clinical MRI system physiological temperature
370C as described elsewhere [7].
All research protocols complied with human ethical
committee of clinical research. Optimized scan parameters were
used to achieve T1, T2 and proton density images of contiguous
slices as described elsewhere [8]. Segmentation using SNAKE
algorithm was used to quantify wall thickness and coronary
artery lumen areas [9]. Segmentation method used delineation
and recognition of region and boundaries of vessels in a given
scene [10]. To validate the surrogate of truth for comparison,
coronary inner and outer wall perimeters were delineated.
Adding up plaque or wall areas from 1 mm thick stacked slices
provided quantification of plaque constituents [10]. % stenosis
and thrombus size was measured as reported elsewhere [10].
High resolution 1-H NMR peaks were obtained in lipid
extracts on a Bruker Bios pin 900 MHz magnet housed atNational High Magnetic Field Laboratory, Tallahassee, FL
operating at frequency of 900 Hz (21.1 T) after water peak (4.6
ppm) suppression by selective Rf saturation; internal standard
CHCl3 (7.24 ppm); TR =10 sec; number of FID 64; Fourier
Transformed using 16 K points; line broadening 1 Hz; acquisition
delay 10 μsec. Peaks were identified on spectra of lipid extracts
from coronary plaque tissue based on a priori knowledge of
their chemical shifts (fatty acid ω-CH3 at ca. 0.86 ppm; -(CH2)
n 1.27 ppm; =CH-CH2- methylene at 2.0-2.2 ppm; =CH-CH2-HC=
methylene at 2.75 ppm; vinyl -CH=CH- protons at 5.3 ppm;
choline head group -N(CH3)3 at 3.3 ppm of phospholipids; sterol
methyl 18-CH3- at 0.4 ppm) as previously reported [10,11].
Using in vivo MRI images, outer and inner vessel radii
measure wall thickness and atheroma size as following and
described elsewhere [7]. Wall thickness T can be measured as
difference of radii (outer R and inner r) as following equation 1:
T = R - r (1)
where atheroma size may be calculated based on atheroma
length L, atheroma rich area B, and vessel radii as following
equation 2:
V(atheroma) = L(2R+r).B/6 (2)
Endarterectomy tissue blocks were fixed by immersion in
10 % neutral formalin. Four-micrometer sections comprising all
layers of the ventricular wall were stained with Hematoxylin and
Eosin with pentachrome [11]. Of the multiple sections of each
endarterectomy, one section was randomly analyzed for further
morphometric measurements. Optimas 6.5 Image analysis
software digitized all arterial segments.
The inner perimeter was defined as the difference of
borderlines between lumen and outer vessel wall. Further
dividing it by 2p, yielded the inner vessel radius. The outer
perimeter was defined by the borderline between tunica media
and adventitia. The outer vessel radius was obtained by dividing
outer perimeter with 2p. Wall thickness was computed as the
difference between outer vessel radii and inner vessel radii.
Angiotensin, insulin, Beta-carotene, TBARS, Malonaldehyde
(MDA), Vitamin E and C, diene conjugates measured oxidative
stress in tissue homogenates of coronary artery segments and
control coronary artery segments without plaques as described
elsewhere [12].
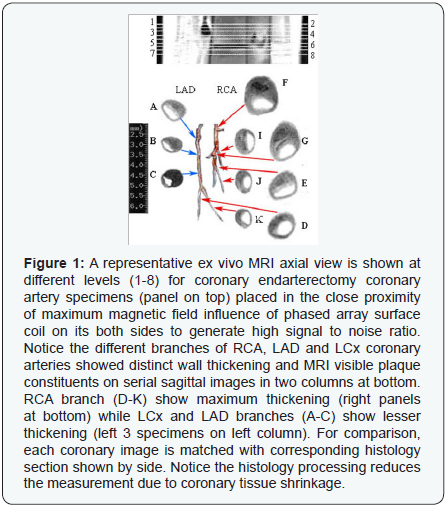
The endarterectomy specimens placed in the close proximity
of maximum influence of phased array surface coil magneticfield generated high signal-to-noise (SNR) ratio. The wall and
plaque constituents were distinct on serial MRI images as shown
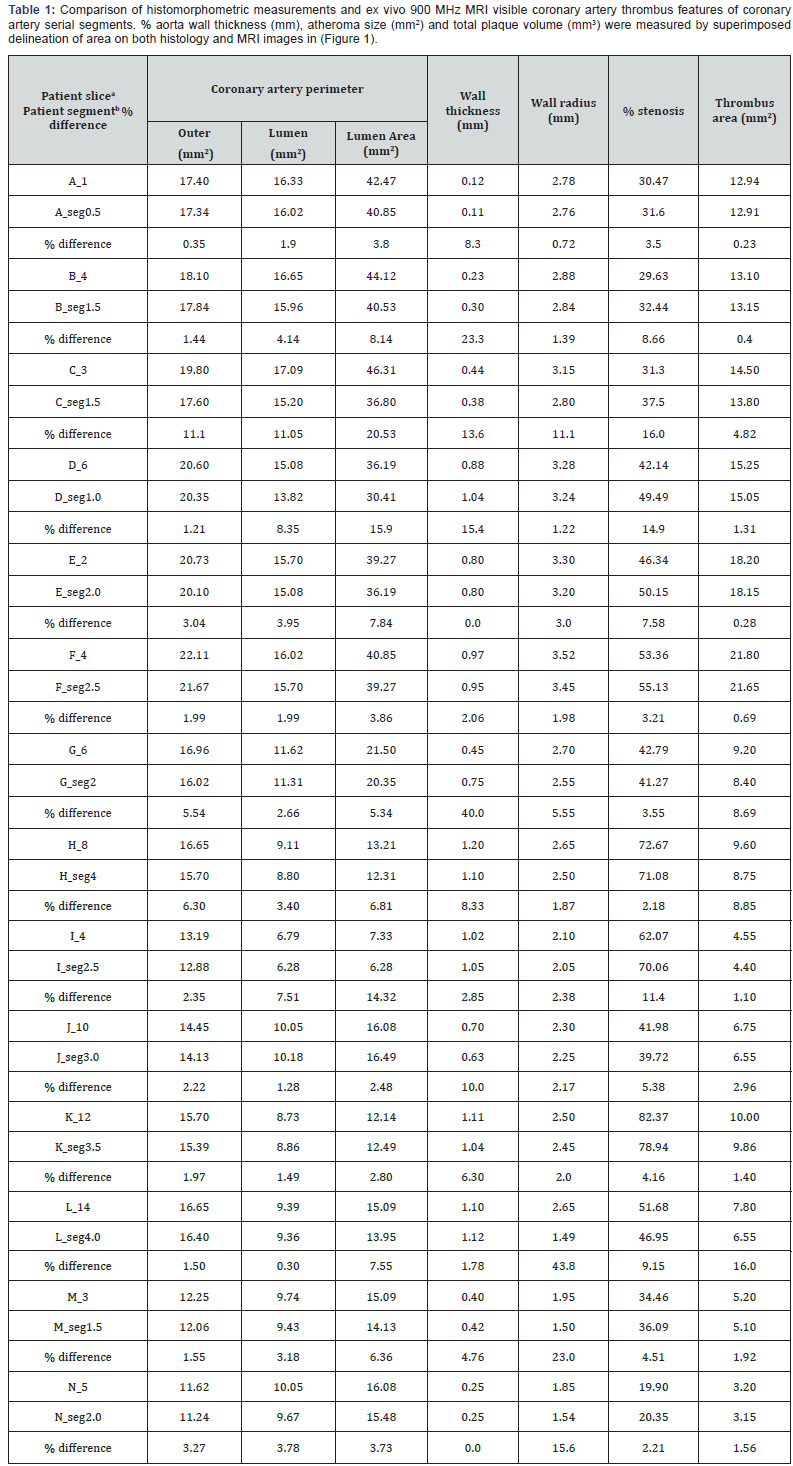
in (Figure 1). Wall thickness and wall radii were calculated by
measuring outer wall and lumen perimeters as presented in the
(Table 1). Lumen area and thrombus area were delineated and
% lumen stenosis was calculated as [area of thrombus / (area
of lumen) x 100%]. Outer vessel radius ranged from 1.0-3.5 mm
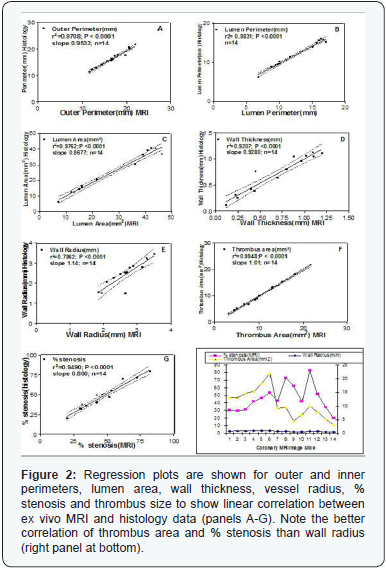
and wall thickness from 0.1-1.0 mm. Wall thickness, % stenosis
and vessel radius comparison is shown in (Table 1 and Figure 2)
as regression plots indicating linear relationship. The standard
error was 6 % above or below the fitted curve. This relationship
was more valid in the large vessels. However, some variation
of measurements was also due to anatomical variability of
coronary arteries.
Coronary artery MRI image mainly defined three
morphometric features i.e. lumen area, wall area and plaque
area. However, several plaque features viz. lipid core, thrombus,
atheroma, calcification, were distinct but not definitive as
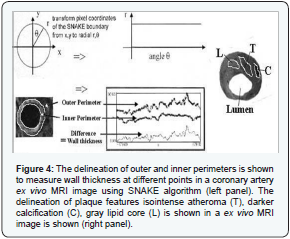
shown in (Figure 3). Using SNAKE algorithm, wall thickness was
measured as shown in (Figure 4).
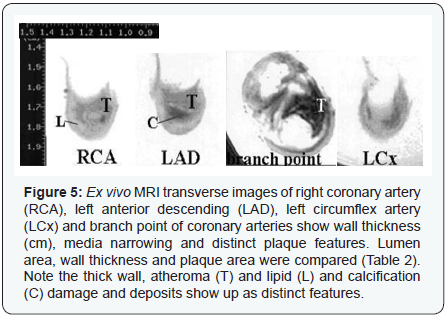
Different levels of MRI image slices showed the in vivo
measurements of right coronary aorta (RCA), left anterior
descending (LAD) and circumflex (LCx) coronary arteries as
shown in (Figure 5 and Table 2) indicating RCA at higher risk.
Plaque features viz. necrotic core, lipid core, atheroma and wider
wall thickness were distinct on MRI images and represented
high percent stenosis as shown in (Figure 5). Different wall
perimeters, lumen area, wall thickness and thrombus size
measurements and their correlation with plaque stability are
shown in (Figure 2).

Histopathology

The endarterectomy coronary artery tissues were white
with smooth surface. However, permanent fixation in formalin
reduced its size due to shrinkage. The histology sections stained with trichrome-Mason showed microscopic distinct features.
The co registration method using ‘edge detection’ for lumen
size, wall thickness, wall radii, and plaque constituents showed
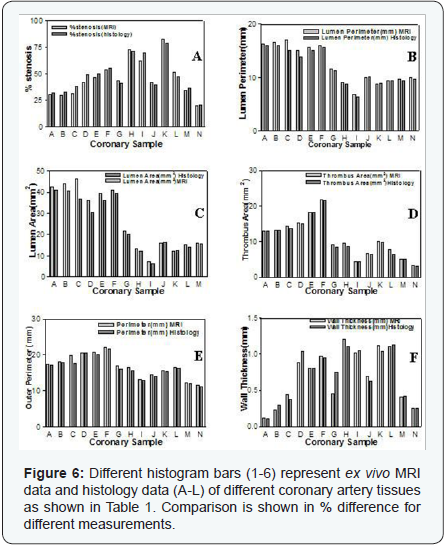
% differences by using MRI and histology methods as shown
in (Tables 1 & 3) (Figure 6). Histopathology characterized
the coronary plaque tissue point-by-point stereotactic match
with their MRI signal intensities. On histology sections, lipids,
calcification, atheroma, elastin, collagen were main plaque
features with fibrous cap, inner wall disruption as shown in
different high power fields in (Figure 3).
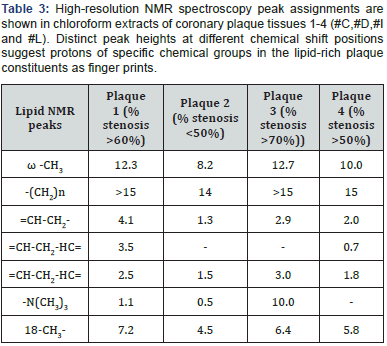
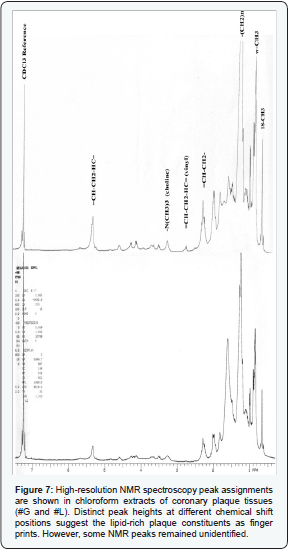
- High-Resolution NMR Spectroscopy of Coronary Plaques: Fatty acid moieties of triglycerides, phospholipids, and cholesterol esters were prominent contributors to the observed proton resonances peaks identified on spectra of lipid extracts from coronary plaque tissue. The peaks showed chemical shifts (fatty acid ω-CH3 at 0.86 ppm; -(CH2)n 1.27 ppm; =CH-CH2- methylene at 2.0-2.2 ppm; =CH-CH2- HC= methylene at 2.75 ppm; vinyl =CH-CH2-HC=protons at 5.3 ppm; choline head group -N(CH3)3 at 3.3 ppm of phospholipids; sterol methyl 18-CH3- at 0.65 ppm based on a priori knowledge of these peak positions as shown in (Figure 7). However, other unidentified peaks at 0.95, 1.5, 2.0, 4.1 and 4.2 were also accountable as shown in (Figure 7).
- Oxidative Stress Markers: Coronary artery normal tissues and atheroma bearing tissue homogenates showed distinct and comparable high values of angiotensin, insulin, beta-carotene, vitamins C and E, TBARS, MDA, diene conjugates contents as shown in (Table 4).
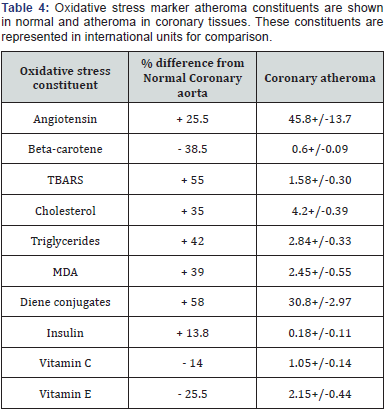
However, cholesterol and triglycerides were similar in both
homogenates as shown in (Figure 7). Very often, high % stenosis
> 60 % and bigger atheroma size were associated with -(CH2)n,
18-CH3- sterol peak, choline head group -N(CH3)3 NMR peaks
and higher oxidative stress markers viz. TBARS, MDA, diene
conjugates in cholesterol rich plaques common in RCA tissues.
Less vulnerable plaques however showed =CH-CH2- methylene,
=CH-CH2-HC= NMR peaks with comparable oxidative markers
common in LAD and LCx tissues. However, it did not rule out the
possibility of other plaque lipids.
Coronary atheroma is the consequence of lipid disorder
and continuous oxidative stress that leads to plaque disruption.
We believe that the size of atheroma and % stenosis serve
as morphometric indices measured as wall thickness and
lumen area. Further, plaque features such as disruption,
fibrous cap, calcium and lipid deposits earlier highlighted the
physiochemical processes in coronary wall [1-4,13,14]. In same
direction, the present study demonstrated the enhanced power
of MRI as tool of MRI-visible coronary vessel morphomteric
measurements and plaque constituents to evaluate degree of
stenosis and thrombosis. It highlighted the use of phased array
coil to get combined T1 weighted, T2 weighting and protondensity
weighted images in wall visualization and validated the
multicontrast MRI signal intensities of different coronary plaque
components at various locations.
MR micro imaging is emerging as the potential noninvasive
ex vivo MR imaging modality. MR techniques differentiate
plaque components on the basis of biophysical and biochemical
coronary tissue properties such as chemical composition,
chemical concentration, water content, physical state, molecular
motion, or diffusion. In present study, ex vivo MR coronary
artery imaging utilized a multi-contrast approach with highresolution
black blood spin echo- and fast spin echo (FSE)-based
MR sequences [15]. The signal from the blood flow is rendered
black through preparatory pulses (e.g. radiofrequency spatial
saturation or inversion recovery pulses) to improve the image
of the adjacent vessel wall. However, bright blood imaging by
3D Fast time-of-flight pulse sequence was also employed in
assessing fibrous cap thickness and morphological integrity of
the coronary artery. This sequence enhanced the signal from
flowing blood and a mixture of T2* and proton density contrast
weighting highlighting the fibrous cap. Atherosclerotic plaque
composition by MRI is generally based on the signal intensities
and morphological appearance of the plaque on T1 weighted,
proton density-weighted, and T2-weighted images as previously
validated [13,14]. Optimized scan parameters and combined
weighting generate good contrast for coronary artery features.
However, this weighting scheme for imaging may suffer from
plaque semi liquid phase and its fatty esters in cholesterol-rich
moiety whose saturated/unsaturated lipid ratio determines
the severity of disease and plaque stability [12,16]. Therefore,
delineation and feature visual identification of coronary vessel
constituents may serve the purpose to some extent.
Adventitia and thin layer of innermost media were poorly
visible in coronary specimens. These observations corroborate
with earlier report on thin fibrous cap, respiratory motion, and
poor lipid rich moiety as factors for T2-weighted MRI visibility
or Contrast Noise Ratio (CNR) of lumen narrowing [13,14]. In
present study, short T2 plaque components were MR visible
such as calcification and thrombus. These components were
quantified in vivo before surgery procedure and correlated with
coronary artery lesion size obtained ex vivo after surgery. The
quantification of lesion size, detection of media thickness and
fibrous cap ‘integrity’ evaluations were main focus. In present
study, the images were acquired with a resolution of 0.25 x 0.25
x 2.0 to 0.4 x 0.4 x 3.0 mm3 by use of a coronary phased-array
coil to improve signal-to-noise ratio and image resolution. A
recent report reviewed the data on coronary aorta composition
and atheroma size with the use of T1-weighted, T2-weighted,
and proton density-weighted images at a resolution of 0.8 x 0.8
x 5.0 mm3 using a phased array coil-high-resolution imaging or
contrast-enhanced MRA by gadolinium-based contrast agents
for plaque neovascularization, necrotic core and fibrous tissue
[14].
In present study, SNAKE contour algorithm demarcated
the distinct lumen and artery wall boundaries in less time
to measure all of the coronary artery size. Coronary artery
wall thickness and areas in CAD were greater than normal
coronary artery. Different branches of coronary artery showed
similar relationship. The correlation of coronary artery wall
and plaque measurements by MRI and histology methods
offered comparison as % difference <6 % and demonstrated
the thrombus area as better plaque stability indicator over wall
thickness. It supported other previous report [15].
The plaques features such as lipids, calcification, atheroma,
elastin and collagen were main plaque features. Fibrous cap,
inner wall disruption were quite distinct on histology sections
but on MRI images only different signal intensities suggested
presence of different components due to limited MRI resolution.
So, we suggest combined information on wall morphology and
plaque features offer better sensitivity and specificity with
possibility of cardiovascular risk.
The present study suggested the % stenosis based on our
new technique [7] to measure wall radii and lumen size as
possible cardiovascular risk marker (no risk with 30-39 %
stenosis; prone to risk with 40-50 % stenosis; mild risk with
50-69 % stenosis; unstable or vulnerable plaque with 70-79%
stenosis; high risk with 80 % stenosis or above). However, wall
thickness also appeared as better risk correlate. Our results
support the previous investigations predicting >50 % stenosis as
considerable risk [15,17]. The current state-of-art using several
modified MR pulse sequences suggested further improvement in
specificity and sensitivity of techniques used.
Saturated and mono- or polyunsaturated (ω-3 or ω-6 esters)
of fatty acid rich phospholipids and triglycerides as major
coronary lipids have been reported by high resolution NMR as
fingerprints [18,16] and partial lack of lipid molecule mobility
was attributed for their accumulation around coronary wall. It
is a disadvantage in clinical time-dependent assessment of lipids
during plaque progression. Presence of high-saturated lipids
and free cholesterol contents reduce the plaque stability or
cause adverse consequence [5,16].
Triglycerides, cholesterol, insulin and angiotensin converting
Enzyme in the atheroma are believed as indicators of plaque
severity and extent of atherosclerosis. Malonaldehyde, TBARS,
and diene conjugates serve as indicators of free radical damage
in artery. Beta-carotene, vitamin E and C decrease with increased
free radical damage and plaque severity indicates coronary artery
at high risk of atheroma. The increased atheroma biochemical
precursors and NMR lipid peaks in artery homogenates indicated the coronary artery disease as consequence of lipid
accumulation in walls or plaques within arteries. Both NMR
and oxidative stress data suggested atherosclerosis as a lipid
disorder [16,18,19]. Moreover, it gave a window to understand
further the possible role of oxidative stress in atheroma
formation. In control coronary tissue homogenates, indirect
measures of oxidatively damaged lipids indicated the lesser
free radical stress or no stress [5]. Higher concentrations of
TBARS indicating high oxidative activity have been observed in
coronary artery disease [6]. Higher triglyceride concentrations
compared to cholesterol in CAD tissue homogenates may be due
to less hydrolysis of triglycerides into fatty acids.
Limitation of this study was that ex vivo investigations
of endarterectomy coronary artery material changed the
morphometric data during fixation and tissue processing such
as shrinkage artifacts during dehydration. Other factors were
limited lipid discrimination on MRI images due to vessel small
size, hyper contracture of vessels and wall tension considerations
while evaluating plaque vulnerability. Some notable improved
blood suppression methods are reported for accurate coronary
plaque imaging by dual-inversion 3D FSE imaging sequence
with real-time navigator technology for high-resolution, freebreathing
black-blood CMRA [20], delineation of coronary artery
by echo planar imaging [21],MRA and True FISP imaging [22,23].
Multicontrast MR imaging may measure dimension of
coronary stenoses in different branches. MRI may visualize
the coronary plaque disruption and atherosclerotic lesion
components, measuring atherosclerotic burden comparable
with histological features. Relationship of outer vessel radius
and wall thickness, plaque atheroma size and % stenosis might
serve as clinical correlates of cardiovascular risk, its response
to therapy and assessment of subclinical disease. These results
indicate possibility of coronary stenosis and thrombsis due to
oxidative stress and lipid disorder.
Author acknowledges the atherosclerosis training and
methods adopted for MRI images in (Figures 1,4, and 5) as pilot
experiments.
For more articles in Open Access Journal of
Cardiology & Cardiovascular Therapy please click on: https://juniperpublishers.com/jocct/index.php
To know more about Juniper Publishers please
click on: https://juniperpublishers.business.site/


Comments
Post a Comment