Morphological and Functional Characteristics of Right Heart in Children-Juniper Publishers
Juniper Publishers-Journal of Cardiology
Abstract
Introduction: In previous
echocardiographic studies less importance is given to the right heart
chambers due to the dominant opinion that the right heart plays a minor
role in the global cardiac function. Recent studies emphasized the
undoubted importance of the right heart and indicated the study of right
heart cavities as priority.
Aim: The aim of this study was
to performe echocardiographic measurements of morphological and
functional parameters of the right atrium and right ventricle in healthy
children and present the results as a possible reference values.
Materials and Methods: The study
included a group of 93 healthy children (48 boys and 45 girls), aged 1
month to 18 years. Dimensions and function of the right atrium and
ventricle were examined by standard and new echocardiographic
techniques.
Results: The values of the
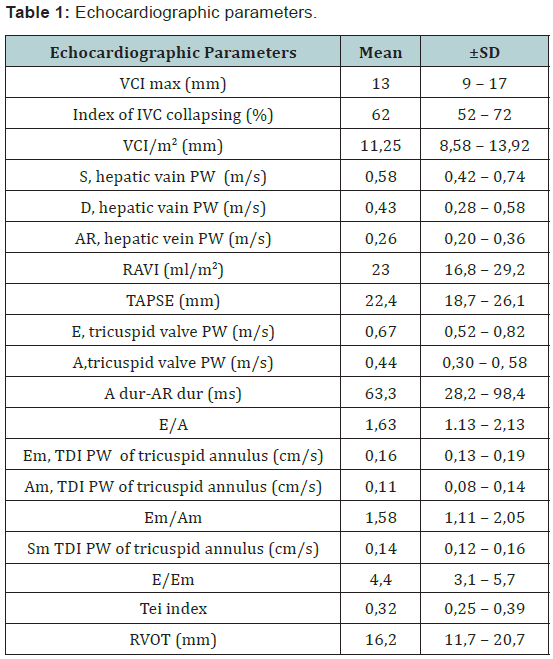
parameters were as follows : VCI / BSA: 11.25 ± 2.67 mm/m2 , RAVI: 23 ±
6.2 ml/m2 , TAPSE: 22.4 ± 3.7 mm , diameter of the RVOT: 16 2 ± 4.5 mm.
PW of hepatic veins: S: 0.58 ± 0.16 m/s, D: 0.43 ± 0.15 m/s, AR: 0.26 ±
0.06 m/s. PW of tricuspid flow E: 0.67 ± 0.15 m/s, A: 0.44 ± 0.14 m/s,
E/A ratio 1.63 ± 0.5 . TDI values of speed of tricuspid annulus
movements: Sm: 0.14 ± 0.02 m/s, Em: 0.16 ± 0.03 m/s, Am: 0.11 ± 0.03
m/s, Em/Am ratio of 1.58 ± 0. 47, E/Em ratio 4.4 ± 1.3 , Tei index 0.32 ±
0.07.
Conclusion: Transthoracic
echocardiography is applicable and reliable method for measuring the
parameters of the morphology and function of the right heart cavities in
children. The values obtained in our study with the supposed limits of
mean ± SD could be used as reference values.
Keywords: Echocardiography, Right heart, Reference values, Healthy children
Abbreviations: BSA: Body Surface
Area; SD: Standard Deviation; SE: Standard Error; RAVI: Right Atrial
Volume Index; TAPSE: Tricuspid Annular Plane Systolic Excursion; IVRT:
Iso Volumic Relaxation Time; Sm: Systolic tricuspid annular Motion,
RVOT: Right Ventricular Outflow Tract; RVEDVi: Right Ventricular
End-Diastolic Volume of the Right Ventricle
Introduction
Although considered the odd organ, in terms of
morphological and hemodynamic sense, the heart may be seen as an even
organ, that is, the left and the right heart. The left heart, which
consists of the left atrium and the left ventricle, is a part of the
systemic arterial bloodstream. It receives oxygenated blood from the
lungs, through pulmonary veins, which is then pumped through the aorta
and systemic arterial network. Deoxygenated blood from the body comes
into the right heart made of the right atrium and ventricle, via the
systemic venous sink and hollow veins, which is then directed into the
lungs for re-oxygenation, via the pulmonary artery and its branches.
Systemic and pulmonary circulation are connected to each other
(circulation in the series) and therefore the normal function of both,
the left and right heart is necessary for the proper functioning of the
cardiovascular system. In addition to equally important role in proper
functioning of the cardiovascular system, less importance is often given
to the right “pulmonary” heart compared to the left ‘systemic’ heart.
The first one, who stressed the true significance and the role of right
heart, was Sir William Harvey. In his work “De Motu Cordis” in 1616, he
wrote: “It can be said that the right ventricle was created to carry the
blood through the lungs, not to nourish it “.
Monitoring of the patients with Fontan circulation,
showed that the absence of contribution of the right ventricle,
significantly changes hemodynamics and the function of the
cardiovascular
system. The assessment of the right heart preservation proved to
be significant in the evaluation and prognosis of conditions such as
pulmonary hypertension, heart failure, right ventricular infarction
and congenital heart defects. In 2006, the US National Institute
of Cardiac, Pulmonary, and Hematological Diseases described as
priority the study of the right heart cavities physiology, their role
in various heart diseases, as well as opportunities for preservation
of their adequate function in these conditions.
The aims of the study
Echocardiographic measurements of morphological and
functional characteristics of the right atrium and right ventricle
in healthy children and tests results presentation, as possible
reference value.
Materials and Methods
The study included a group of 93 healthy children, preclinically
examined, with no signs and symptoms of the
cardiovascular system diseases. The children were aged 1 month
to 18 years (9.3 ± 5 yr.), and the children of both sexes were
included almost equally (48 boys and 45 girls). The study was
conducted at the Department of Cardiology at the University
Children’s Hospital in Belgrade in 2005 and 2013. Body surface
area in children (BSA body surface area) was calculated using
the Haycock formula (BSA [m2] = 0,024265x weight [kg] 0.5378
x height [cm] 0.3964), and BMI using the formula: weight [kg]/
height[m]2. Echocardiographic measurements were performed
using a high-quality echocardiographic device Phillips iE33.
During the measurements, the children were lying on their back
or on the left decubital position with electrodes attached to record
the ECG simultaneously. ECG recording served us primarily for
assessing sinus rhythm, frequency and the phases of the cardiac
cycle.
The dimensions and function of the right vestibule were
examined by standard (M-mode, 2D echocardiography, Pulsed
Doppler) and new (Tissue Doppler) echocardiography techniques.
All measurements were carried out in three consecutive cardiac
cycles and the mean was taken as valid one. The most convenient
moment of the measurement was the normal expirium of a child,
with shallow breathing, without strain and thus, the respiration
influence on the obtained values was reduced to a minimum. The
checks were recorded on the appropriate media and subsequently
analyzed “offline” by the child cardiologist.
The obtained values of all listed parameters were statistically
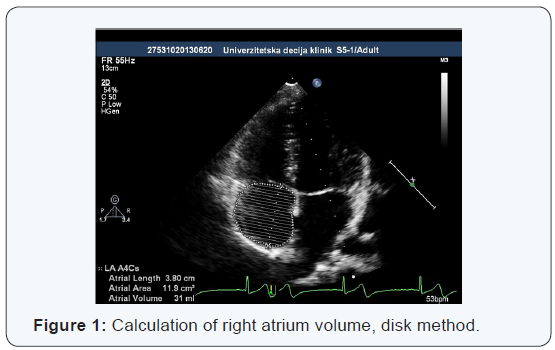
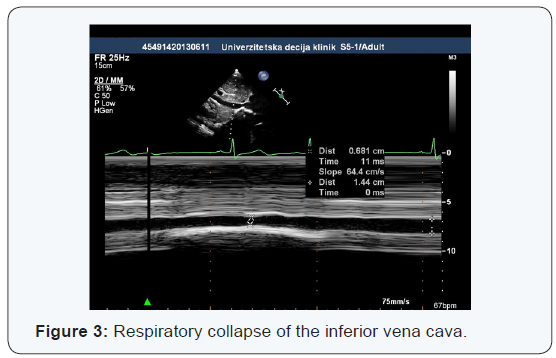
processed and presented in the form of tables and charts [Table
1] [Figures 1-9]. The study protocol met the ethical criteria of the
Helsinki Declaration, and before the examination, the parents of
children were informed about its nature and the use of the results
in our study. The children were subjected to these examinations
only after the written consent of their parents.



In the statistical analysis, the data were expressed as mean,
minimum and maximum values, and standard deviation (SD)
and standard error (SE) were calculated. The nature of the
echocardiographic variables distribution was assessed by
Kolmogorov-Smirnov test. In the case of the normal distribution,
T test was used for comparison of mean values. The differences
in proportions were calculated by Chi-square test. Correlation
analysis was performed by Spearman and Pearson methods
in accordance with the type of data distribution. The value p
<0.05 was considered statistically significant. All analysis was
performed in SPSS version 14.0 for Windows operating system.
Echocardiographic study included measurements of the following
parameters: RAVI (Right Atrial Volume Index), PW Doppler of the
flow in the hepatic veins, the maximum diameter of the inferior
vena cava and the index of respiratory collapse, TAPSE - tricuspid
annular plane systolic excursion, tricuspid flow PW Doppler,
Tissue Doppler of tricuspid annulus, Tei index.
Results
Having done the echocardiographic examination of healthy
children, we got certain values of measured parameters that
we presented in the form of table and text as well as minimum
and maximum values, and the mean ± SD too. We assessed the
associations, that is, the correlation level of values of various
measured parameters, by statistical analysis, and it showed that,
in most cases, there was a slight connection. The assessment was
carried out on the basis of the values of obtained correlation
coefficient (r).
Slight correlation (r=of ± 0.20 ± 0.40) was present in the case
of the relationship of the following parameters: E ↔Tei, A↔Tei,
E↔RVOT, TAPSE↔RVOT, Sm↔RAVI, Sm↔TAPSE, Sm ↔RVOT,
Em↔RAVI, Em↔RVOT and Am↔RAVI. Significant correlation
(r = from ± 0.40 to ± 0.70) was present between the values of
parameters RAVI↔TAPSE RAVI↔RVOT. Using Student’s T test we
were determining the significance of differences in the results
of our study in relation to the results of similar studies carried
out earlier. The only significant difference was shown between
the value of Tei index and RVOT diameter obtained in our study
compared to other studies. (P<0.05).
DiscussionOptions of echocardiographic analysis of right heart in children
Apart from the view that the right heart chambers are
relatively unsuitable for the ultrasound, it is interesting that
the recent studies carried out in children do not emphasize
the problem of echocardiographic unavailability of the right
vestibule and ventricle. Quality records, which are relatively
independent of the position of the right ventricle, the heart
rate and frequency, are characteristics of new non-dimensional
echocardiographic techniques such as tissue Doppler, speckle
tracking echocardiography etc.
The analysis of the right heart cavities morphology is,
professionally, the most demanding and the most time consuming,
due to the specific geometry and trabecular structure of the walls
of the right ventricle and harder obtaining of quality section of
retrosternally placed right ventricle. A large number of analysis
are carried out from the corresponding sections, primarily from
the apical four-chamber one, that provide a good enough idea of
the morphology and function of the right heart cavities. In the
childhood, chest wall is thinner the percentage of cartilage is
higher in the bone structures, which, as such, in the absence of
deformity, do not hinder echocardiography greatly. On the other
hand, an aggravating circumstance is an increased heart rate,
which complicates the analysis of specific echocardiographic
parameters and frequent lack of cooperation of the child during
the examination.
In our study, during the examination of healthy children and
the measurement of previously mentioned parameters, there
were not any difficulties in obtaining adequate echocardiography
sections and a quality 2D image. All the necessary measurements
were successfully carried out for each child included in the study.
Diameter VCI
It was found out by echocardiographic studies that the inferior
vena cava diameter varies significantly during respiration. Also,
during the breathing, there are significant changes of VCI in both,
cranio-caudal, and medio-lateral direction which reduces the
accuracy of measurement. To increase the applicability of the
results obtained, the diameter of inferior vena cava should be
indexed by body surface, and the phase of respiration, in which
the measurement was performed, should be defined. Significant
changes in diameter VCI in dehydrated children were proven in
several studies, thus, its value can be considered as an indicator
of the child hydration degree. The lack of reference values for
children of certain age makes it difficult to objectively evaluate
the hydration.
In our study, the maximum diameter of the VCI had similar
values as well as in other studies that dealt with echocardiographic
examination of healthy children. Average maximum diameter
of the inferior vena cava was 11.3 ± 2.7 mm / m2 body surface
area, while the average index of collapsing of VCI was 62 ± 10%.
The results indicate that these values could indicate a normal
hydration and central venous pressure in children, which could be
used as reference values in everyday routine practice.
Krause [1] measured the diameter of the VCI in children
with terminal kidney disease before and 1 hour after dialysis.
The average diameter of the VCI in the phase of inspiration
and expiratory flow, indexed by body surface, was significantly
different in children before and after dialysis (1.12 ± 0.38 vs
0.75 ± 0.26 cm) and was significantly correlated to the change in
body weight before and after dialysis. There was no significant
correlation in regard to different weight in children before dialysis.
Dehydration is a very common condition in pediatric practice.
Sometimes, an unrecognized dehydration or the degree of
dehydration, that was incorrectly assessed, can complicate the
treatment of the patient. Also, an excessive rehydration can often
negatively affect the morbidity and mortality of a sick child. It is,
therefore, very important to find an adequate method of rapid
and reasonably accurate assessment of a child hydration degree.
Clinical signs of dehydration in children are not always reliable,
and invasive measurement of central venous pressure is usually
not justified. Therefore, the difference in diameter of the inferior
vena and abdominal aorta (IVC/Ao Index) stands out as a quick
and easy non-invasive method of evaluating child hydration.
Lei Chen [2] found a significant difference between the values
of IVC / Ao Index of dehydrated and healthy children (0.75 vs 1.01), as well as the difference in dehydrated children before and
after rehydration (0.75 vs 1.09). Index IVC / Ao was significantly
higher in healthy and rehydrated children in regard to dehydrated
children. Examining healthy young people by echocardiographic
examination, Kosiak [3] came to the reference values for IVC /
BSA from 8 to 11.5 mm / m2 and IVC / Ao of 1.2 ± 0.17. In his
study, Natori [4] demonstrated a significant positive correlation
between the diameter of VCI and pressure in the right atrium,
which confirms that the measurement of this echocardiographic
parameter can be used as a non-invasive method of pressure
assessement in the right atrium.
The flow in the hepatic veins
Spectrogram of PW Doppler of the hepatic veins flow consists
of antegrade systolic and diastolic confluence into the inferior
vena cava and retrograde flow in the phase of contraction of
the atria. Three-phase spectrogram is not present in all healthy
children and its absence should not be interpreted as a mandatory
sign of impaired right heart hemodynamics.
With all the children involved in our study during the
echocardiographic examination, we found a clear three-phase
flow in the hepatic veins. Systolic flow rates were higher than
diastolic flow rates (0.58 ± 0.16 m / s vs 0.43 ± 0.15 m / s), and
the rates of retrograde flow were significantly less during atrial
contraction (0.26 ± 0.06 m / s). The rates that were found fit into
the normal spectrogram of the venous confluence into the right
atrium. The results were not significantly different from those
obtained by Amoozgar [5] in his study, in children with normal
pressure in the right atrium.
Examining spectrograms of hepatic venous flow in healthy
children, Jequier [6] found a distinctive three-phase flow in all
three hepatic veins in only 42% of children. According to the
author, the thing that could indicate a disturbed flow in the hepatic
veins is a change in pre-existing three-phase flow into two-phase
or single-phase flow. The middle and the left hepatic veins had
the most consistent three-phase flow, while the right hepatic
vein, in addition to being less accessible for the examination,
had the largest percentage of two-phase and single-phase flow.
Single-phase flow in the hepatic veins is most often found in the
neonatal age. The complete lack of retrograde flow could indicate
an increased vascular resistance in the hepatic veins that could be
seen in a variety of liver diseases with reduced hepatic compliance.
Flow rates in the hepatic veins proved to be a good indicator
of pressure in the right atrium. In his study, Amoozgar [5]
compared the hepatic venous confluence in children with
congenital heart disease, who had the pressure in the right
atrium previously measured by the direct manometry during
cardiac catheterization. It showed that the change in speed of S
waves, during the respiration for more than 38%, indicates the
pressure in the DA higher than 8 mmHg, with a sensitivity of 90%
and a specificity of 51.3%. The maximum speed of the systolic
confluence, lower than 0,7m / s, indicated a pressure in the DA higher than 8 mmHg, with a sensitivity and specificity of 70%
and 82.1%. Maximum expiratory diastolic confluence faster than
0.63 m/s was an indicator of the pressure in the DA higher than
8 mmHg, with a sensitivity of 60% and a specificity of 92.3%.
The speeds of hepatic venous confluence showed some changes
in different phases of respiration. In the group of children with
the measured pressure in the DA less than 8 mmHg of the mean
flow rate of the inspiration and expiratory flow, were significantly
different (Si 0.92 m / s vs 0.56 m / s; Di 0.73 m / s vs De 0.46 m /
s; ARi vs 0.43 m / s ARe 0.32 m / s) while the AR wave lasted for
84.3 msec in average.
The rates of hepatic venous flow are also affected by changes
in intra abdominal and intra thoracic pressure, as well as changes
in cardiac function. Increased pressure in the right cardiac cavities
will increase the hepatic vein pulsatility, while the increased intra
thoracic pressure (Valsalva maneuver) will reduce venous inflow
and pulsatility of the hepatic veins.
The volume of the right atrium
The best indicator of morphological changes in the right
atrium in a variety of hemodynamic disorders is its volume, that
is, volume value indexed in relation to the surface of the body -
RAVI (Right Atrial Volume Index). In the states of hypovolemia or
volume overload as is the case in the presence of an atrial septal
defect, there are significant changes in the dimensions of the right
atrium and ventricle. However, studies have shown a very rapid
and significant reversibility of these changes after transcatheter
closure of ASD. In our study in healthy children, we found the
average value of RAVI from 23.06 ± 6.2 ml / m2, which is not
significantly different from the reference values obtained in the
other studies.
In the study Kucinska [7], the changes in children with ASD
after transcatheter closure of defect Amplatzer septal occluder,
were examined. Within 24 hours after the closure, there was a
significant normalization of dimension DA and DV, while in the
next three months, most of the dimensions of the right cardiac
cavities, returned to normal values. A period a bit over two years,
after the removal of the volume load, was needed to normalize
the transverse diameter of the right atrium and the diameter of
the right ventricular outflow tract. Nevertheless, it has been found
that in children with transcatheter closed ASD, significantly faster
hemodynamic recovery occurs, in relation to children in whom ASD
was closed surgically. In new echocardiography recommendations
in the assessment of morphological characteristics of the right
atrium, RAVI of normal value of 21ml / m2 is increasingly stated
as a good indicator.
In his study, Sallach [8] examined the possibility of the use
of RAVI value in assessing the degree of systolic and diastolic
dysfunction of the right ventricle, as well as the clinical prognosis
of patients with chronic heart failure. The results showed that
the RAVI is a good determinant of right ventricle function and
independent risk factor for long-term morbidity and mortality
Mean values of obtained RAVI were 31 ± 15 ml / m2 for men and
21 ± 12 ml / m2 for women (p = 0.0001). RAVI ≥ 41.6 ml / m2, with
a sensitivity of 68% and a specificity of 92% indicated a NYHA III
or higher functional class of heart failure. RAVI ≥ 30.6 ml / m2 i
indicated, with a sensitivity and specificity of 78% and 77% in the
RV, systolic dysfunction of RV grade ≥ 3. RV diastolic dysfunction
greater than grade 3, was related to RAVI ≥ 37.8 ml / m2 with a
sensitivity and specificity of 80%.
Increased value RAVI does not always have to represent
pathological findings. By examining active athletes, Ascenzi [9]
found higher values RAVI (26.96 ± 7.28 ml / m2) compared to the
control group of people who do not do any sport actively (19.89
± 4.99 ml / m2). In this case, the increased values RAVI along with
increased right ventricular diameters and specific functional
changes of right heart are explained as a physiological adaptation
to intensive trainings and are placed in the context of the “athlete’s
heart”.
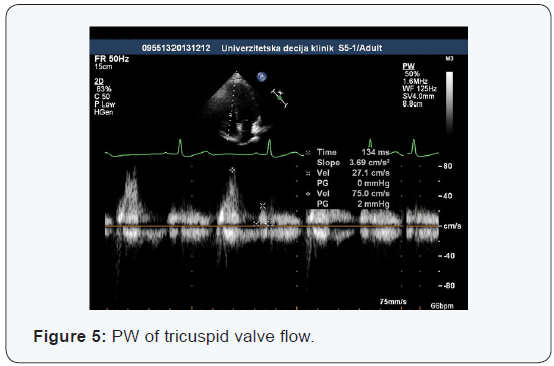
Doppler echocardiography tricuspid flow
The speed and the duration of individual phases of tricuspid
inflow are a good indicator of right ventricular diastolic function,
that is, its relaxation and diastolic pressures. Two speeds are
analyzed on the spectrogram (early –E, and late - A diastolic
inflow) and two intervals (isovolumic relaxation time - IVRT and
diastasis). The spectrogram of tricuspid inflow shows certain
changes during respiration which are considered normal. From
inspiration to expiratory flow, the speeds of tricuspid inflow
increase, the early E inflow for about 25%, and late A inflow
for about 20%, and E / A ratio remains unchanged. Because
of these changes, tricuspid inflow measurements by Doppler
methods, must be defined and interpreted in relation to the
phase of respiration in which they are made. The age of a child
has no significant impact on the values of the tricuspid inflow
parameters, except in the neonatal age, when the normal result is
of higher speed of A waves compared to the E wave.
Normal functioning of the right atrium, tricuspid valve, as
well as adequate compliance of the right ventricle is necessary for
the adequate diastolic function of the right heart. With diastolic
dysfunction, the first changes include the increase of function of
the right atrium tank and pumps, while at later stage, conduit
function dominates. At the same time, depending on the cause of
diastolic dysfunction, there is a reduction of compliance and an
increase in the right ventricle diastolic pressure. These changes
are reflected in the spectrogram PW of Doppler tricuspid inflow.
The state of hydration can also change the appearance of the
tricuspid inflow spectral curve.
Our study showed tricuspid inflow speed values that
fit into
existing spectrogram models of a heart with normal function.
Early diastolic tricuspid inflow was significantly of a higher speed
compared to the late diastolic inflow during the atrial contraction
(0.67 ± 0.15 m / s vs 0.44 ± 0.14 m / s) so that the average ratio
of the early and the late diastolic inflow was 1.63 ± 0.5. In atrial
contractions, the right ventricle was filling with blood on average 63.3
± 35.1 ms longer than the inferior vena cava and hepatic
veins, which corresponds to normal hemodynamic conditions.
By measuring in children with congenital heart defects,
Amoozgar [5] analyzed obtained values in relation to invasively
obtained pressure in the right atrium. In children with the
pressure in DA lower than 8 mmHg, the values obtained are: E
wave in inspiration 1.05 ± 0.25 m / s, E wave in expirium 0.82
± 0.24 m / s, A wave in inspiration 0 77 ± 0.21 m / s, A wave in
expirium 0.62 ± 0.15, the length of wave A (AD) 118.13 ± 34.19
msec. Children with pressure in DA, higher than 8 mmHg, had the
following values: E wave in inspiration 1.18 ± 0.29 m / s, E wave in
expirium 0.90 ± 0.19 m / s, A wave of inspiration 0 72 ± 0.30 m / s,
A wave in expirium 0.69 ± 0.17,the length of A waves (AD) 123.67
± 40.32 msec. It has been found that the calculated Ei / Ai is higher
than 1.88 the pressure indicator in DA higher than 8 mmHg, with a
sensitivity of 60% and specificity of 82.5% .
In a study, which Vermilion [10] carried out in children with
pulmonary stenosis parameter values before and after balloon
valvuloplasty were compared, as well as the values before
valvuloplasty with values in healthy children. In children with
pulmonary stenosis parameter values were significantly different
compared to values in healthy children in terms of a larger A
wave (0.64 ± 0.28 vs 0.39 ± 0.08 m / s) and a lower E / A ratio (
1.11 ± 0.52 vs 1.76 ± 0.45). In patients before and after balloon
valvuloplasty, significant changes had not been found in the
measured parameters of tricuspid inflow. There was a significant
difference in the pressure gradient in the right ventricular outflow
tract before and after the intervention. The results showed
decreased early diastolic filling and increased right atrium pump
function in children with pulmonary stenosis. After balloon
valvuloplasty there were no significant changes in the spectrum
of diastolic filling of the right ventricle, which could indicate that
the residual decreased compliance is a result of right ventricular
hypertrophy caused by the obstruction of its outflow tract. The
mean values of tricuspid inflow parameters in healthy children
were as follows: E wave of 0.66 ± 0.1 m / s, A wave of 0.39 ± 0.08
m / s, E / A ratio of 1.76 ± 0.45.
In the study Jie Liu [11], the impact of reducing preload was
analyzed, simulated by applying negative pressure to the lower
part of the body of 60 mmHg, to the speeds of tricuspid inflow.
Reducing the preload has led to a significant reduction in the
speed of early E diastolic inflow (0.712 ± 0.081 m / s vs 0.556
± 0.102 m / s), while it has not significantly increased the rate
of late A tricuspid inflow (0.41 ± 0.078 m / s vs 0.453 ± 0.076 m
/ s). There had been a significant decrease in E / A ratio (1.79
± 0.38 vs 1.26 ± 0.32). Three minutes after the termination of
high pressure effects on the lower part of the body, the values of
examined parameters were normalized. These results suggest the
possible use of PW Doppler of tricuspid inflow in the detection
of decreased preload with the decentralization of bloodstream in
conditions such as acute dehydration, bleeding, and peripheral
vasodilatation with capillary leakage in various states of shock.
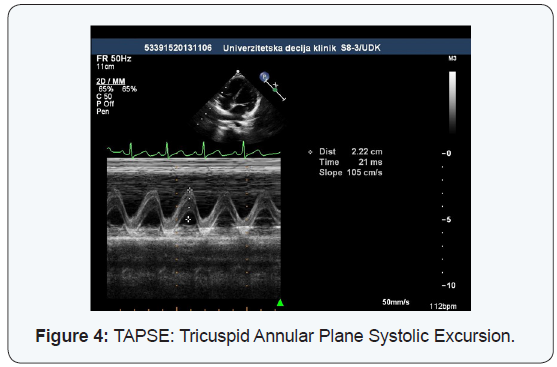
TAPSE (Tricuspid Annular Pulse Systolic Excursion)
The moving of the tricuspid valve annulus, between the end
of diastole to the end of systole chamber, is a very good indicator
of right ventricular systolic function and it correlates well with
the parameters of systolic function obtained by right diagnostic
cardiac catheterization and using magnetic resonance imaging.
TAPSE however, represents only the impact of the right ventricular
entrance on systolic function, while the contribution of outflow
tract is assessed on the basis of the shortening fraction of that part
of the right ventricle. The assessment of right ventricular systolic
function of the standard methods used in the left ventricle such as
ejection fraction and shortening fraction, is harder to do, because
of its irregular geometry, trabecular walls and retrosternal
position. This problem is particularly seen in children with
congenital heart disease where, a wide range of abnormalities in
the structure, shape and position of the right ventricle, is present.
In healthy children included in our study, TAPSE average
value was 22.4 ± 3.7 mm, which, due to the most common age
of the children in our study, fits in with the reference values that
Nunez Gil [12] got in his study. In our study, lower limit value of
TAPSE that you get when you subtract the mean value of 2 SD,
would come to 15 mm. By examining the healthy children, Nunez
Gil [12] come to the value of TAPSE which he characterized as a
reference for certain ages. The mean value in all age groups was
17.09 ± 5.09 mm. TAPSE values ranged from 10.56 ± 3.96 mm
in newborns, to 20.95 ± 6.54 mm in children aged 13-18 years.
There were no significant differences between the sexes. Body
surface area showed a strong positive correlation with the values
TAPSE, while heart rate showed a negative correlation with
TAPSE. TAPSE values, in relation to the body surface area (BSA),
differed at different average values BSA in certain age groups
and it was to 13.17 mm / m2 at an average BSA of 1.59 m2. In the
neonatal age 5th percentile TAPSE was 7.8 mm, while in the age of
children older than 5 years, 5th percentile TAPSE was 15 mm. All
of these values obtained in healthy children contribute to proper
interpretation and clinical applicability of the values TAPSE in
children with various heart diseases.
Perhaps the most important use of TAPSE is in children
with pulmonary arterial hypertension. Koestenberger [13] cites
a number of studies that have shown a significant reduction in
the value of TAPSE in patients with pulmonary hypertension
compared to healthy children. As a determinant of progressive
damage to the right ventricle systolic function, TAPSE value 2
SD below the normal value for age, was defined. With the speed
of systolic tricuspid annular motion (Sm), TAPSE becomes the
method of choice for routine assessment of right ventricular
systolic function in the monitoring of patients with pulmonary
arterial hypertension.
The diameter of right ventricular outflow tract (RVOT) changes
in the states of loading the chamber with pressure or volume.
Increased diameter indicates a reduced load carrying capacity
by the right ventricle and the possible existence of its function impairment. Healthy children who participated in our study had
an average diameter of RVOT 16.2 ± 4.5 mm. Our values were
significantly lower than those that Koestenberger [14] got (25.1 ±
3.2 mm), also examining healthy children. The only difference was
that, in our study, RVOT measurements were performed in the
longitudinal parasternal section, while Koestenberger took the
measurements of the transverse parasternal cross-section, which
may be the reason for the different values of the diameter of right
ventricular outflow tract. We should not ignore the differences
in the subjective assessment of endocardial borders RVOT by the
examiner during the measurement of the diameter, or the impact
of the quality of the echocardiographic device measurement on
the measuring results. In summary, this parameter is subject
to subjective variability which is why it should be treated with
caution in the functional analysis of the right ventricle.
Tissue velocity of tricuspid annulus
Tissue Doppler method can directly measure the speed
of the part of right ventricular myocardium. Using pulsed TDI
echocardiography with volume sample on the lateral attachment
of tricuspid annulus, we measure systolic and diastolic motion
velocities of that part of the right ventricle. Speed systolic tricuspid
annular motion (Sm) proved to be a good quantitative parameter
of right ventricular systolic function in children.
Right ventricular systolic function is an important indicator of
the global heart function in a variety of congenital and acquired
heart disease. Due to the unfavorable geometry and position of the
right ventricle, an adequate and accurate assessment of its systolic
function by conventional methods used for the assessment of left
ventricular function such as ejection fraction and shortening
fraction, was difficult to do. Ejection fraction of the right ventricle
can be most accurately obtained using magnetic resonance, but
this method is not yet available for routine use in patients with
heart disease. Echocardiographic methods would be beneficial for
assessing right ventricular systolic function that are feasible in
daily practice, and yet, on the other hand, in good correlation with
the indicators obtained by magnetic resonance imaging.
Measuring movement of the lateral attachment of tricuspid
annulus in healthy children, we got that the maximum speed of
early diastolic movement (0.16 ± 0.03 m / s), which are slightly
higher than the speed of systolic motion (0.14 ± 0.02 m / s). The
speeds of late diastolic movements (0.11 ± 0.03) are significantly
lower than both systolic and early diastolic speeds of movement
of that part of the right ventricle. This ratio of myocardium
movement speed has given the average values Em / Am ratio of
1.58 ± 0.47 and E / Em ratio of 4.4 ± 1.3, which are, judging by the
results of the studies previously carried out on healthy children,
considered normal.
The values E / Em obtained in our study in healthy
children,
changed by more than ± SD, and particularly changed by more
than ± 2SD may indicate changes in pressure in the hollow veins,
that is, in central venous pressure. It is noteworthy that none of
the above parameters itself is not a sufficient indicator of the right
heart function. By joint analysis and perceiving the changes in the
values of several parameters, from the index of collapsing VCI, the
volume of DA, the speed of tricuspid flow to the movement speed
values of tricuspid annulus, obtained by TDI method, we gain a
more complete picture of possible hemodynamic changes.
So far, relatively little is known about the right ventricular
systolic function in children with congenital heart defects. The
nature and degree of changes in these children and mechanism of
functional recovery following surgical treatment are insufficiently
explained. Koestenberger [15] examined changes in speed
Sm in children with congenital heart disease and pulmonary
hypertension as well as in children with tetralogy Fallot, after
operative correction of the fault. He assessed the value of Sm as
an indicator of right ventricular systolic function compared to EF,
and end-diastolic volume of the right ventricle (RVEDVi) obtained
by MRI. The results of this study showed that the rate of Sm has
been significantly reducing 10.4 years after the development of
PAH in children with congenital heart defect, that is, in the state
of load pressure of the right ventricle. In children, after tetralogy
Fallot surgery, where volume overload is present, a significant
reduction in Sm speed comes 13.6 years after surgery.
It could be concluded that it takes a longer time period of
the right ventricle volume load to reach significant damage of its
systolic function, and that the right ventricle is less sensitive to
the state of volume overload compared to the load pressure. It is
assumed that in the period of an infant and a small child, “adaptive
hypertrophy” of the right ventricle occurs, but the chamber cannot
tolerate the load or volume pressure for a long time, and over the
time, the mandatory dysfunction occurs. A significant positive
correlation was recorded between the Sm speed and EF right
ventricular, while significant negative correlation was present
between Sm speed and end-diastolic volume of the right ventricle.
Based on these correlations, Sm speed can be characterized as
a reliable and easily measurable indicator of right ventricular
systolic function.
Tüller [16] also found good correlation between the speed
of systolic movement of lateral part of tricuspid annulus with EF
obtained by magnetic resonance imaging. The threshold value Sm
of 0.12 m / s was used to identify the right ventricular systolic
dysfunction with sensitivity of 86% and a specificity of 83%.
There was a direct correlation between the values of Sm and EF of
right ventricular. The speed Sm higher than 0,12 m / s indicated
the normal EF> 55%, the speed Sm between 0.12 and 0.08 m /
s the EF middle weakened 30-55%, while the EF lower than 30
% was indicated by the Sm speed lower than 0.08 m / s and all
that with a sensitivity and specificity of about 80%. In other,
similar studies, the Sm value of <0.10 m / s as an indicator of a
significant impairment of o the right ventricle systolic function, is
emphasized.
Rafeiyian [17] showed the measurement results of PW tissue
Doppler of the lateral tricuspid annulus in healthy children of
different ages and presented them as possible reference values.
Slower speed of early diastolic movement and lower ratio of
early and late diastolic movements in newborns was perceived.
The biggest changes of parameter values have occurred during
the first year of life, which indicates the most important changes
in the growth of the structure and function of the right ventricle
during this period. In his study in healthy children, Ascenzi [9] got
the following values of TDI parameters: Em 0.17 ± 0.04, Sm 0.14 ±
0.03, 0.11 ± 0.04 Am, Em / Am 1.70 ± 0, 49, E / Em 4.11 ± 1.05. Our
values of the same parameters did not differ significantly.
Tei index
Tei index or myocardial performance index is another method
that attempts to overcome the problem of assessment of the right
ventricle global function due to improper geometry and unsuitable
retrosternal position. This problem is particularly seen in children
with congenital heart disease where the shape and position of
the right ventricle is additionally disrupted. Tei index proved to
be simple, reliable, reproducible method of examining the right
ventricle function. It is calculated by combining indicators of
diastolic (IVRT) and systolic (IVCT, ET) component of the right
ventricle function. The parameters for calculating the Tei index
are obtained by using PW Doppler alone or in a combination with
tissue Doppler.
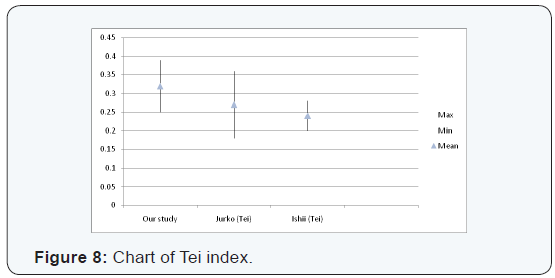
In our study, we obtained slightly higher average value of Tei
index (0.32 ± 0.07) compared to other studies. The difference in
the value of Tei index probably arises from individual differences
of examiners while assessing and marking the boundaries of
time intervals on the spectrogram of Doppler techniques that
are needed to calculate the Tei index. This depends on both
the quality of thespectogram recording, that is, the quality of
echocardiography devices, as well as from the experience and
subjective assessment of the examiner. In all these studies, we can
see that the values of Tei index have to significantly vary from the
reference values, in order for it to be interpreted in terms of right
ventricular dysfunction.
Ishii [18] calculated Tei index in children with ASD after
Senning operation, and compared the results with the value of
Tei index in healthy children. It turned out that, the value of the
right ventricle Tei index in children is independent of age, heart
rate, blood pressure, degree of tricuspid regurgitation and the
degree of pulmonary hypertension. The mean value of Tei index
was significantly different in children after Senning operation
compared to healthy children (0.58 ± 0.09 vs 0.24 ± 0.04), while
there was no significant difference between children with ASD
and healthy children ( 0.25 ± 0.13 vs 0.24 ± 0.04). It could be said
that cardiac function is significantly more resistant and longer
preserved in the states of volume overload in ASD. After Senning
operation right ventricle remains systemic and works opposite
high systemic pressure and in this case there is a significant and
early hypertrophic remodeling and the damaging of its function.
Similar conditions are present in the existence of pulmonary
arterial hypertension, in which Tei started the implementation of
the index and registered significantly higher values of 0.93 ± 0.34 compared to the healthy population.
By testing healthy children, Jurko [19] got an average value of
Tei index for DV 0.27 ± 0.09, and for LV 0.32 ± 0.07. The value of
Tei index of LV, unlike DV, differs in relation to the age of the child
and in children under 3 years, it is significantly higher compared
to older children (0.40 ± 0.09 vs 0.33 ± 0.22). In the case of the
right ventricle dysfunction, there is a gradual lengthening of IVRT
and IVCT while ET shortens, it leads to an increased value of Tei
index, so that we can say that the higher Tei index value, the worse
the heart function is .
The analysis of correlation between the values of echocardiographic parameters
When assessing the existence of correlation between the
values of different echocardiographic parameters, we realized
that significant correlation coefficients, with respect to other
parameters, are more often shown by tissue Doppler parameters
with values RAVI, TAPSE and RVOT diameter. According to that,
it could be said that for faster, and yet reliable assessment of
right heart cavities function, measuring of previously mentioned
parameters can be used, and on the basis of their values changes
, the changes in the value of other important parameters can
be assumed. The volume of the right atrium is very sensitive to
hemodynamic changes and it significantly changes in the states
of right heart load, either by pressure or volume. These changes
are usually reversible, but their level is a reliable indicator of
introducing, correcting and monitoring the success of heart
disease treatments. The values TAPSE and RVOT diameter reflect
the functional state of the right ventricle, except that TAPSE
represents a share of inflow part of DV, and diameter RVOT a share
of RV outflow tract in its overall function. Some tissue Doppler
parameters clearly represent the systolic (IVCT, Sm) and diastolic
(IVRT, Em, Am) function of the right ventricle, while the global
cardiac function is estimated from Tei index as a function of the
above parameters [20-33].
Conclusion
In our study, as in other recent studies that dealt with
echocardiographic right heart analysis in children of different ages,
significant difficulties in obtaining adequate echocardiographic
images and values of certain parameters, did not occur. It tells us
about transthoracic echocardiography as a reliable method for
measuring morphology indicators and function of the right heart
cavities in children. By examining the interconnections of certain
parameter values, in certain cases we got easy to significant
positive correlation, that is, the cases in which, changed values of
certain parameters indicate possible changes to the values of other
parameters in the same direction. A significant correlation was
found between the parameters: RAVI↔TAPSE and RAVI↔RVOT.
By reviewing and analyzing the existing literature, we found
possible reference values, as well as the threshold values of
echocardiographic parameters that can indicate a disorder of cardiac function. The values obtained in healthy children included
in our study, in almost all cases, did not significantly differ from
the reference values obtained in other studies (excluding the
value of Tei index and diameter RVOT), so that our value, with the
assumed limits of mean ± SD, could be used for the same purpose
[33-40].
Recent works in this area show the new echocardiographic
methods such as strain rate and speckle tracking echocardiography
to enable easier, more objective and more accurate analysis of the
minimum, initial changes in the function of the right heart, which
will greatly contribute to an easier and more precise diagnosis
and improved treatment of heart diseases in children.


Comments
Post a Comment