Impact of Cardiac Resynchronization Therapy on Cardiac Electric Remodeling and its Clinical and Echocardiographic Correlation-Juniper Publishers
Abstract
Aim: impact of cardiac resynchronization therapy on cardiac electric remodeling and its clinical and echocardiographic correlation.
Patients and Methods:50 patients
candidate for CRT were included and assessed before and 3 months after
implantation by history taking, clinical examination, transthoracic
echocardiogram, ECG and six minutes walk test.
Results:50 patients (35 males and
15 females, mean age 54.88±7.48 years) with implanted CRT. All patients
were in sinus rhythm, QRS duration ≥120 ms and LBBB. There was clinical
response to CRT as NYHA class improved p<0.001 and 6 min walk test
p<0.001, electrocardiographic response where apart from RR interval,
there were significant differences in QRSD, QT, QTc, QTd, and TPE
between pre and post CRT measurements (P<0.001) and echocardiographic
response as LV volume improved in 78%, EF in 14% and change (ΔQRSD)
significantly correlated with changes in NYHA, LVEDD, LVESD, and LVEF.
(ΔQTd) significantly correlated with change in NYHA but not with
echocardiographic changes. But ( ΔTPE) significantly correlated with
LVEDD, LVESD, LVEDV, LVESV, and LVEF but not with ΔNYHA. Area under the
curve was 0.813 for ΔQRSD (p=0.005), 0.56 for ΔQT (p=0.56), 0.59 for
ΔQTc (p=0.41), 0.823 for ΔQTd (p=0.004), and 0.8 for ΔTPE (p=0.007).
ΔQTd of ≥-20 ms had highest sensitivity for predicting both clinical and
Echocardiographic response, while ΔQRSD of ≥-20 ms had highest
specificity.
Conclusion:CRT induced reverse
electric remodeling including depolarization and repolarization changes
on unpaced ECG that was associated with reverse structural remodeling
and clinical improvement.
Introduction
Heart Failure (HF) represents approximately 1–2% of
the adult population in developed countries with the prevalence rising
to ≥10% among persons70 years of age or older [1]. There are many causes
of HF; however the most common cause of HF is coronary artery disease
[2]. What characterizes untreated systolic dysfunction is progressive
worsening of these changes over time, with increasing enlargement of the
left ventricle and decline in EF, even though the patient may be
symptomless initially. The goals of treatment in patients with
established HF are to relieve symptoms and signs, prevent hospital
admission and improve survival [3].
The idea of CRT is based on the concept of improving
dyssynchronus conduction of the heart by biventricular pacing which
leads to a significant alleviation of symptoms and increase in exercise
capacity. On average, NYHA function class decreased by 0.5–0.8 points,
the 6 min walk distance increased by 20%, and peak oxygen consumption
increased by 10–15%. The functional benefits and quality of life
improvements were sustained [4].
A consistent finding in the randomized trials
designed with up to 6 months of follow-up has been an up to 15% absolute
reduction in LV end-diastolic diameter and up to 6% increase in LVEF
following CRT [2]. REVERSE trial showed a significant degree of reverse
LV remodeling was observed among the patients assigned to CRT,
manifested by decreases in the LV end systolic and diastolic volumes and
an increase in LVEF [2]. Non responders to CRT (defined as patients who
doesn’t show decrease in NYHA classification more than 1 within 3
months after CRT) have been defined in one third of the patients [5].
Electric remolding in HF occurs due to left
ventricular dyssynchrony and it can be predicted by the following: QRS
duration: in patients with HF, left ventricular electrical
dyssynchrony is associated with QRS prolongation, it would
predict the mechanical dyssynchrony therefore can predict the
response to CRT based on the idea of biventricular pacing will
decrease the left ventricle dyssynchrony thus will decrease QRS
duration [6].
QT interval, QT dispersion & QTc
They are considered to be sensitive indicator of left
ventricular dyssynchrony. We can assume that QT dispersion
becomes longer when cardiac pathological changes occur
causing left ventricular dyssynchrony and will be improved
after CRT, thus can be a good predictor of reverse electrical
remodeling following CRT [7].
T wave morphology & T peak –T end dispersion
T wave amplitude variability (TAV) can be a promising non
invasive predictor of arrhythmogenic events in patients with
cardiomyopathy. The decrease in TAV after CRT is associated with
left ventricular reverse remodeling and it indicates reduction of
the arrhythmogenic event, so it can be of good predicting value
for patients follow up after CRT [7].
Aim
Impact of cardiac resynchronization therapy on electric
remodeling of the heart and its clinical and echocardiographic
correlation.
Patients and Methods
The study was conducted on fifty patients who are candidate
for CRT at National Heart Institute in the period from October
2014 to June 2015. All patients had CRT-P devices (St. Jude)
and were assessed before and at least three months after
implantation
Inclusion criteria:
All patients fulfilled all the following criteria:
- New York Heart Association (NHYA) functional class III or ambulatory class IV in heamodynamically stable condition for at least 4 weeks despite optimal medical treatment.
- Left ventricular ejection fraction (LVEF) less than or equal to 35% as assessed by echocardiography.
- Intraventricular conduction delay defined by a QRS duration ≥ 120 m sec if LBBB or >140msec if non LBBB.
- All patients were on optimal recommended pharmacological therapy including (ACE inhibitors or ARBS, B blockers, Aldosterone antagonists and diuretic).
Exclusion criteria:
- NYHA class I or II.
- Narrow QRS complex.
- Ejection fraction more than 35%.
- Presence of atrial fibrillation.
- Amiodarone therapy.
- Device malfunctions.
Each patient was subjected to history taking, clinical
examination, transthoracic echocardiogram, 12 lead surface ECG
and six minutes walk test before implantation and followed by
reevaluation at least three months after implantation. ECGs were
done with CRT off mode to acquire native electrocardiograms
then Echocardiography and six minutes walk test were done for
every patient to assess response.
Investigations
ECG acquisition and analysis:
Standard 12-lead surface ECGs with a paper speed of 25
mm/s and 10 mm/mV gain were analyzes prior to and at least
three months after implantation while setting the device to
CRT-off mode. CRT-on mode was restored after acquiring ECGs.
Measurements were assessed manually and taken from the
average of 2 measurements made by 2 Cardiologists who were
blinded to each other’s measurements and to patients’ data. The
following measurements were taken:
- PR interval (normally 0.12 to 0.20 sec)
- QT interval measured from the beginning of QRS to the end of the T-wave defined as the point of return to the isoelectric line. QTc interval was calculated by Bazett’s formula (QTc=QT/square root of RR interval in seconds). Intervals were measured in the lead with the highest T wave amplitude among leads II, V5, or V6, using the same lead in pre and post-CRT ECGs (The normal value for the QTc in men is ≤0.44 sec and in women is ≤0.45 sec).
- QT dispersion (QTd), defined as the difference between the longest and shortest QT interval among all lead ( normal values from 10 to 71 ms)
- T wave peak to end (TPE) duration, defined as the duration from the peak to the end of T wave in II, V5, V6 according to the highest T wave amplitude, using the same lead in pre and post-CRT ECGs.
Intrinsic QRS duration (QRSD) and axis (The entire QRS
duration normally lasts from 0.06 to 0.10 seconds) .
Echocardiography
Trans-thoracic echocardiographic examination with machine-integrated ECG recording was performed, mostly with
the patients lying in the left lateral decubitus position, using a
Vivid 5 Dimension machine with an M4S matrix sector array
probe with a frequency range of 1.5 to 3.6 MHz (GE Vingmed
Ultrasound, Horten, Norway Left ventricular EF, dimensions and
volumes (LVEDV & LVESV) were measured utilizing modified
Simpson’s equation (The endocardium of the apical two and
four chamber echocardiographic views in systole and diastole is
traced manually.
Wall motion abnormality at rest and was assessed for
patients by dividing the left ventricle into 16 segment and
assessment of each segment according to the American Society
of Echocardiographys as follow;
- normal
- hypokinesis
- akinesis
- dyskinesis
Mitral regurgitation
Degree of mitral regurge were assessed before and after
CRT implantation according to The 2003 American Society of
Echocardiography’s consensus statement on echocardiographic
quantification of valvular regurgitation and classified into (mild
to moderate, moderate to severe mitral regurgitation according
to jet area measurement as follow Mild < 4 cm, moderate 4-8cm
and sever>8cm).
Left atrium Diameter
Was assessed for every patient pre and at least three months
after CRT implantation in the PLAX view. Pulmonary artery
systolic pressure: for diagnosis of Pulmonary hypertension
PASP was estimated from the tricuspid regurgitant jet velocity
using the modified Bernoulli equation and adding the estimated
right atrial pressure (RAP) on the basis of inferior vena cava
(IVC) diameter and collapsibility as follow IVC ≤2 cm and >50%
collapsibility, 5 mm Hg; IVC >2 cm and ≥50% collapsibility, 10
mm Hg; IVC >2 cm and <50% collapsibility, 15 mm Hg; and IVC
>2 cm and no collapsibility, 20 mm Hg. We assumed RAP 10 mm
Hg for cases with IVC ≤2 cm and ≤50% collapsibility.
6 min walk distance
Which is a simple objective measurement to assess patient’s
functional capacity.
Technique:
- Flat, straight corridor 30 m (100 feet) in length.
- Turnaround points marked with a cone.
- Patient should wear comfortable clothes and shoes.
- Patient rests in chair for at least 10 minutes prior to the test (ie, no warm -up period)
- Record baseline heart rate and blood pressure.
- Instruct the patient to walk as far as possible for 6 minutes.
- At the end of the test, the spot where the patient stopped was marked at the floor .
- The distance walked was recorded and calculated.(Borg GA.1982)
- The test was performed to each patient before and at least three months after device implantation.
Implantation data: Pacing leads were inserted through
standard subclavian vein approach. The RA lead was placed
in RA appendage, The RV lead tip was placed in the apex of
the right ventricle. The LV lead tip was placed in the posterolateral
cardiac vein when possible or in an alternative posterior
or lateral vein. The location chosen for LV lead was that giving
the greatest spatial separation from the tip of the RV lead, with
stable LV capture and without diaphragmatic capture at four
times threshold voltage .Device programming was done during
follow up of the patients in the outpatient clinic to assess lead
impedances, pacing, sensing thresholds, optimization of AV and
VV delays and detection of device malfunction.
Implantation data:
Complications of CRT implantation include coronary sinus
or coronary vein trauma, pneumothorax, diaphragmatic/phrenic
nerve pacing, and infection were assessed for all patient.
Criteria of CRT Response:
Response to CRT can be divided into 2 main categories:
clinical end points indicating improved clinical status (NYHA
functional class by ≥1 NYHA class, quality-of-life, exercise capacity
expressed as 6-min walking distance) and Echocardiographic
end points indicating improved LV systolic function or reversed
LV remodeling (decrease in LV end systolic volume by ≥15%) [6].
Electrocardiograic predictor to clinical and
Echocardiographic response is defined as decrease in intrinsic
QRS duration by ≥20 ms [8].
Statistical Analysise
Continous variables were expressed as mean ± Standard
deviation. Paired and unpaired and Student’s t-test and
nonparametric tests were used for comparisons between
baseline and follow up.
Categorical variable were expressed as numbers or
percentages were analyzed with the chi-square test. D’Agostino-
Pearson test for normal distribution was done and accordingly, non parametric test was chosen when distribution was nonnormal.
Comparison between continuous data before and
after CRT was done using paired t-test. Comparison between
continuous data in responders and non responders was done
using unpaired t-test or Mann-Whitney test as appropriate.
Receiver operating characteristic (ROC) analysis were carried
out to examine the predictive ability of ECG parameters to the
response to CRT and to determine cut-off values, sensitivity
and specificity for each ΔiQRS duration .The area under curve
(AUC) provided a measure of the overall discriminative ability
of a model.
Correlations were made using Pearson correlation
coefficient or Spearman rho as appropriate. Risk assessment for
ECG parameter was expressed by unadjusted odds ratio after
dichotomization according to the cut off values. P value was
considered significant if < 0.05.
Results
This single center, prospective study included 50 patients
(35 males and 15 females, with mean age of 54.88±7.48
years) with implanted CRT device in the period from October
2014 to June 2015. All patients were assessed twice at the
time of implantation and 3 months after. All patients were in
sinus rhythm, with baseline QRS duration ≥120 ms and LBBB
morphology. All programmable data were accepted with ≥98%
biventricular pacing.
Demographic data of the studied patients
The study included 50 patients 35 males (70%) and 15
females (30%), with mean age of 54.88±7.48. In 50% of the
patients the underling etiology was ICM and the other 50% was
DCM.
II. Risk factors: 24patients (48%) were hypertensive, 22
patients (44%) had diabetes mellitus, 30 patients (60%) had dyslipidemia and 10 patients (20%) were smokers.
Clinical response to CRT
NYHA class
20 patient (40%) improved from NYHA class (III →I ), 8
patients (16%) improved from NYHA class (III →II ), 8 patients
(16%) improved from NYHA class (IV →I ),4 patients (8%)
improved from NYHA class (IV →II ) and 10 patients (20%)
remained in the same NYHA class 3 months after CRT (Table 1).
Results of Chi-square test showed that before CRT
implantation72% of the patients were NYHA class III and 28%
were NYHA class IV after CRT 58% were class I, 24% were class
II, 16% were class III and 2% were class IV with p value< 0.001
(Table 1).

Six minutes walk test
- The mean 6MHW distance at baseline was 160.40 + 28.92 meters reaching 264.04 ± 45.29 meters 3 months after CRT implantation (P value 0.001) (Table 2).
- The improvement in the distance was detected in 40 cases who are clinical responders that represent about 80% of studied cases (Table 2).

- There was statistically significant correlation between NYHA class improvement > 1 class and six minute walk distance p=0.001 (Table 3).

Electrocardiographic response to CRT:
All ECG parameters were taken without pacing (with CRT off
mode) 3m after CRT implantation. Apart from RR interval, there
were highly significant differences in QRSD, QT, QTc, QTd, and
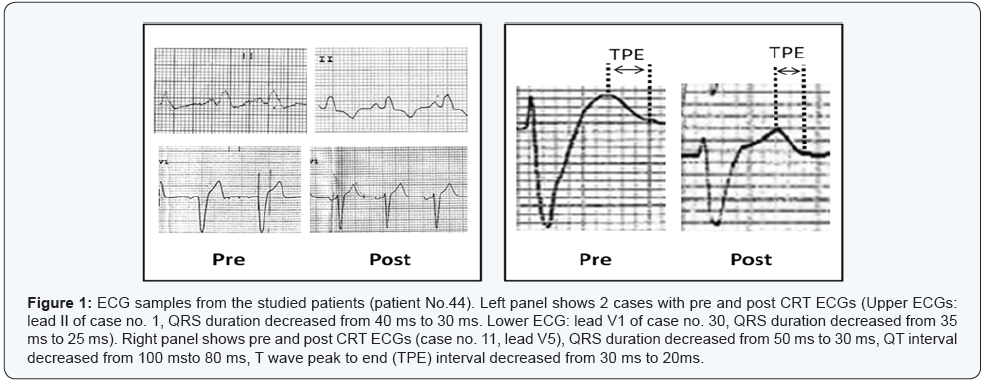
TPE between pre and post CRT measurements (P<0.001) (Table
4 & Figure 1).
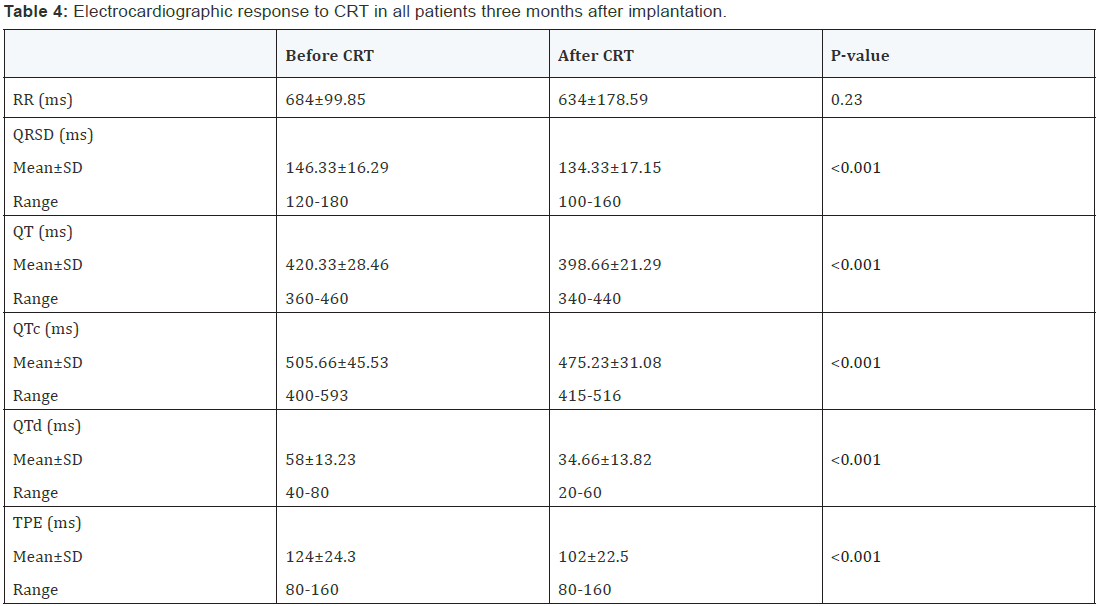
Mean change in QRSD (ΔQRSD) was -12±9.96 ms (median
-20 ms). ΔQT was -21.33±19.07 ms (median -20 ms). ΔQTc was
-30.45±36.03 ms (median -23.5 ms). ΔQTd was -23.33±15.82 ms
(median -20 ms). ΔTPE was -22±22.5 ms (median -20 ms).
Echocardiographic response to CRT
- Regarding left ventricular volume 39 patients improved representing 78% of study cases.
- Regarding left ventricular ejection fraction patients with significant improvement with>10% increase in EF were 7 patients representing 14% of study cases.
- There was statistically significant difference in LVESV before and after CRT. P value was 0.003.
- There was statistically significant difference in LVEDV before and after CRT. P value was 0.002 (Table 5).

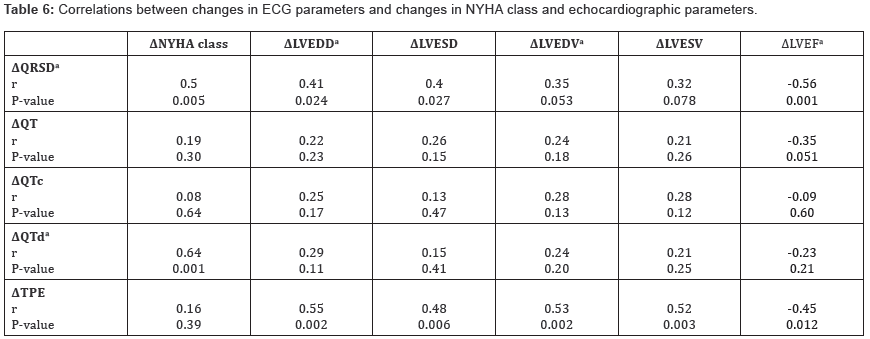
Correlations between changes in ECG parameters and changes in NYHA class and echocardiographic parameters
Change in native QRSD (ΔQRSD) was significantly correlated
with changes in NYHA class, LVEDD, LVESD, and LVEF. (ΔQTd)
was significantly correlated with change in NYHA class but did
not correlate with any of the echocardiographic changes. On the
other hand, (ΔTPE) was significantly correlated with changes
in LVEDD, LVESD, LVEDV, LVESV, and LVEF but did not correlate
with ΔNYHA class (Table 6).
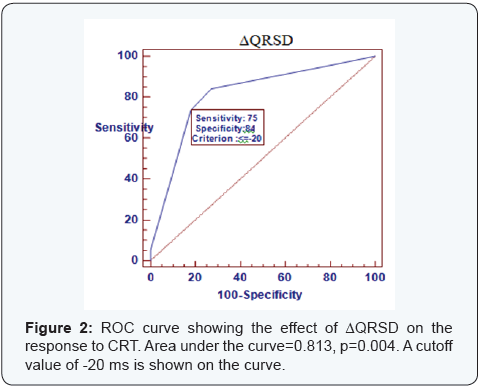
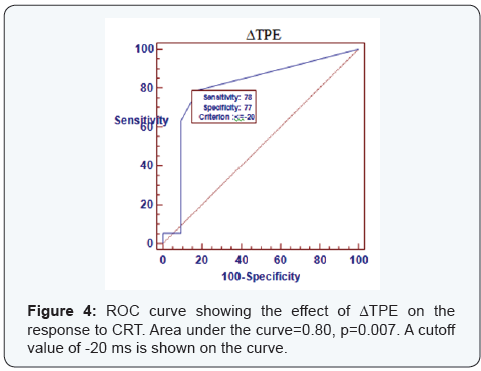
ROC curve
ROC curve analysis was done to find the best cutoff values for
the changes in ECG parameters associated with the clinical and
Echocardiographic response to CRT (Figures 2-4). Area under
the curve was 0.813 for ΔQRSD (p=0.005), 0.56 for ΔQT (p=0.56),
0.59 for ΔQTc (p=0.41), 0.823 for ΔQTd (p=0.004), and 0.8 for
ΔTPE (p=0.007). ΔQTd of ≥-20 ms had the highest sensitivity for
predicting both clinical and Echocardiographic response, while
ΔQRSD of ≥-20 ms had the highest specificity.
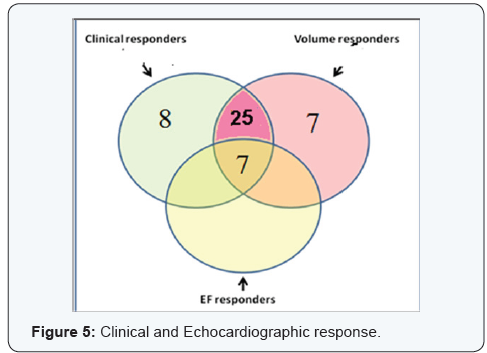
Both clinical and Echocardiographic response occurred in 32
patients (64 %) who were considered as CRT responders. Clinical
response without criteria of Echocardiographic response was
found in 8 patients (16 %), while Echocardiographic response
without clinical improvement was found in 7 patients (14 %)
(Figure 5).

Complications related to CRT implantation
Patients who had immediate complications after implantation
of CRT represented (0.8%): 2 patients had hematomas at site of
implantation representing (0.4%), 2 had diaphragmatic pacing
representing (0.4%).
Discussion
Cardiac resynchronization therapy has been shown to
improve heart failure, reduces hospitalization and improves the
status of LV dysfunction. However, a number of patients remain
unresponsive to therapy. The cause of unresponsiveness has
been an issue of research in many trials and has been a concern
in follow up of CRT patients [6].
Electric remodeling in HF is associated with adverse clinical
outcome. Widening of the QRS complex is associated with
mechanical dyssynchrony, while prolongation of repolarization
in associated with ventricular arrhythmias and sudden cardiac
death [3].
The main focus of this study was to evaluate the impact of
Cardiac Resynchronization Therapy on electrical remodeling of
the heart and its clinical and Echocardiographic correlation after
three months of implantation.
In this study there were significant changes in both
depolarization and repolarization parameters on surface ECG
after CRT. Also there were significant differences between
responders and non responders regarding changes in QRSD,
QTd, and TPE. Furthermore, these changes were significantly
correlated with changes in NYHA class and echocardiographic
parameters. Changes in QRS duration (ΔQRSD) and repolarization
heterogeneity (ΔQTd and ΔTPE) could predict response to CRT
with high sensitivity and specificity [9].
Regarding CRT response
In our study, 8 patients had clinical improvement without
criteria of echocardiographic response, which might be due to
more patient compliance to therapy or may be placebo effect.
Therefore, correlations with ECG parameters were done only in
patients with both clinical and echocardiographic response who
were defined as CRT responders. Response to CRT occurred in
32/50 patients (64 %), which is similar to the generally reported
rate of response [10]. All CRT responders in this study had ≥15%
reduction in LVESV which is considered the hallmark of LV
reverse remodeling [11]. Hence, the occurrence of ECG changes
in responders indicates association between reverse electrical
and structural remodeling following CRT.
Regarding RR interval
There was no significant change in RR interval on the ECG
after CRT. This agrees with the studies of Henrikson and Sebag
[9] who reported similar observations [9]. The pretreatment
with β blocker and/or ivabradine by the majority of patients
who implanted CRT may explain this finding.
Regarding QRS duration: In our study, native QRSD decreased
significantly after CRT (from 146.33±16.29 to 134.33±17.15
ms, p<0.001). This may indicate partial recovery of left bundle
branch conduction. Sebag et al. [12] reported similar findings in 85 patients who were evaluated after 1 year of CRT (intrinsic
QRS decreased from 168.0 ± 19.7 to 149.6 ± 31.6 ms, p < 0.0001).
They considered patients with decrease in intrinsic QRSD by>-
20 ms as “electrocardiographic responders”, who had greater
rate of clinical (p=0.035) and echocardiographic (p=0.023)
response [12].
Another study of Mischke et al. [13] showed that there was
significant decrease in native QRSD one year after CRT device
implantation [13].
Also Dizon et al. [14] reported a case with loss of LBBB and
complete normalization of QRS complex after CRT [14].
In contrast to these findings of our study, Stockburger et al.
[15] did not find any decrease in unpaced QRSD after CRT in a
series of 21 patients. This controversy may be explained by:
- About one third of their patients were on amiodarone
which influences intraventricular conduction,
The different methods of ECG interval measurement (Stockburger et al. [15] relied on computed measurement, while our study relied on manual method) - The variable duration in HF before CRT; longer duration
might be associated with irreversible fibrotic changes
[15].
Our study observed that ΔQRSD was significantly larger
in responders than non responders. ΔQRSD also correlated
significantly with changes in NYHA class, LV diameters, and LVEF.
It was found that a ΔQSRD of ≥-20 ms could predict response
to CRT (p=0.003) with 75% sensitivity and 84% specificity.
Similarly, [12] reported that a ΔQRSD of ≥-20 ms was optimal for
predicting both clinical and echocardiographic response. Since
QRSD is well known as a predictor of total mortality and sudden
cardiac death in patients with HF [16], the decrease in native
QRSD after CRT may affect prognosis [16].
Tereshchenko et al. [17] reported that reduction of native
QRS complex by -10 ms after CRT was associated with a fourfold
decrease in the risk of death or sustained ventricular tachycardia
[17].
Regarding QT and QT dispersion
In heart failure patients, the altered ion channel dynamics
result in prolongation and heterogeneity of repolarization. In our
study, there were significant reductions in native QT, QTc, and QT
dispersion (QTd) after CRT. We did not calculate the corrected
QTd (QTc dispersion) as it was previously reported that QTd
is independent of heart rate [18]. Unlike ΔQT and ΔQTc, ΔQTd
was significantly larger in responders than non responders,
and correlated significantly with ΔNYHA class. We found that
a ΔQTd of ≥-20 ms could predict response to CRT (p<0.001) with sensitivity of 100% and specificity of 67%. In contrast to
these findings; Henrikson et al. [9] and Sebag et al. [12] found
no significant changes in native QT and QTc after CRT. However,
since they did not exclude patients on antiarrhythmic drugs,
their assessment of repolarization could not be relied upon.
Despite the significant reductions in QT and QTc intervals after
CRT in our study, they did not predict response to CRT [9,12].
Regarding to T wave peak to end (TPE) interval
The peak of T wave coincides with epicardial repolarization,
while the end of T wave coincides with endocardial repolarization
[19]. In heart failure patients, the preferential prolongation of
the M cell action potential results in a transmural dispersion
of repolarization (TDR), which can be estimated from the ECG
as the interval between the peak to the end of the T wave [20].
TPE interval may be less dependent on cardiac depolarization
changes than QT measurements, and may therefore provide
a more reliable estimation of ventricular dispersion of
repolarization in patients with wide QRS complex [21]. In 1081
healthy subjects, reference value of TPE interval was 94 ms in
men and 92 ms in women and was independent of heart rate,
therefore, does not need to be corrected [22].
In our study, baseline mean TPE interval was higher
than normal (124±24.3 ms), which significantly decreased
after CRT. Previous studies reported that TPE prolongation
was independently associated with increased risk of sudden
cardiac death in cardiovascular disease [21], but not in healthy
population [23]. The Reduction of TPE interval may indicate
partial reversal of the adverse electric remodeling associated
with heart failure. Furthermore, ΔTPE was higher in responders
than non responders and correlated significantly with changes
in all echocardiographic parameters that indicate reverse
structural remodeling. We found that a ΔTPE of ≥-20 ms could
predict response to CRT (p=0.001) with sensitivity of 78% and
specificity of 77%. To the best of our knowledge, there are no
previous data regarding the predictive value of changes in native
repolarization heterogeneity on surface ECG after CRT.
In our study 20 patient (40%) improved from NYHA class(III
to I) , 8 patient(16%) improved from NYHA class (III to II),8
patient (16%) improved from NYHA class(IV to I),4 patient
(8%) improved from NYHA class (IV to II) and 10 patient
(20%) remained in the same NYHA classes 3 months after CRT
implantation.
The results of our study are in agreement with Ypenburg et al.
[24] they studied 302 patients with NYHA class III-IV and LVEF ≤
35% with a wide QRS complex, to define the rate of responders
and reverse remodeling for follow up of 6 months after CRT.
About 57% of the patients improved in one NYHA functional
class and 12% showed an improvement of two NYHA functional
classes while 31% remained unchanged at 6 months follow-up
after CRT. The reason for unresponsiveness to CRT in this study was attributed to presence of a large percentage of ischemic
patients in the whole study population which accounted for 58%
compared to non ischemic whom accounted for the rest of the
study population [24].
The result of study of Stellbrink et al. [25] was in concordant
to our study as they studied 25 patients with advanced heart
failure for follow up 6 months after CRT implantation with
echocardiographic measurements of both dimensions and
volumes. The aim of the study was to investigate whether
CRT leads to long-term improvement in LV diameters and
reduces LV volumes in patients with HF and whether baseline
echocardiographic variables were predictive of long-term
improvement after CRT. In Stellbrink et al. [25] study the mean
LVEDD and LVESD were significantly reduced after CRT. The
mean LVEDD was reduced from 71 ± 10 to 68 ±11 mm and LVESD
was reduced from 63 ± 11 mm to 58 ±11 mm respectively [25].
The author concluded that spherical shape in dilated hearts
was associated with increased wall stress, and that a change in
LV sphericity have been correlated to an increase in exercise
capacity and may involve a reduction in regional wall stress,
myocardial oxygen demand and functional MR [25].
In our study, there was statistically significant difference as
regards to 6 MHW distance in clinical responders with NYHA
class improvement ≥one class shows difference in the distance
walked Form (160.40 ± 28.92) to (264.04 ± 45.29) three months
post implantation with p value (0.001). On the other hand
patients who develop no improvement in NYHA class show
modest increase in distance that range from (159.50±27.92)
to (163.40 ± 32.92) with p value (0.432) it means that clinical
responders shows corresponding increase in six minute walk
test coinciding with functional class improvement. The study
of Yu CM [10] was in concordant to our study .they enrolled
Twenty-five patients with NYHA class III to IV heart failure and
electrocardiographic wave complex duration>140 ms receiving
biventricular pacing therapy were assessed serially up to 3
months after pacing, Echocardiography, six minutes walk test
were performed . Echocardiography show improvement in left
ventricular (LV) end-diastolic (205+/-68 versus 168+/-67 mL,
P<0.01) and end-systolic volume (162+/-54 versus 122+/-42
mL, P<0.01); and improved 6-minute walk distance after pacing
for 3 months that was considered objective measurement of
clinical improvement [10].


Comments
Post a Comment